TPC-C Test Report
Background Information
TPC-C is a widely recognized benchmark suite established by the TPC Council for evaluating the performance of database Online Transaction Processing (oriented towards OLTP capabilities). It involves 10 tables and simulates five types of business transactions: NewOrder (creation of new orders), Payment (payment processing for orders), OrderStatus (inquiry for recent orders), Delivery (order delivery), and StockLevel (analysis of stock shortage status). TPC-C measures the maximum qualified throughput (MQTh) of a system in terms of tpmC (Transactions per Minute), where Transactions are based on the NewOrder Transaction, and the final unit of measure is the number of new orders processed per minute.
This article uses Benchmark-Boot to verify the performance of PolarDB-X.
Note The TPC-C implementation in this article is based on the TPC-C benchmark test but is not comparable with published TPC-C benchmark test results, as the tests in this article do not meet all the requirements of the TPC-C benchmark test.
Benchmark Boot is a one-stop stress testing platform developed for PolarDB-X, currently supporting benchmarks including Sysbench, TPC-C, and TPC-H, and enhances testing efficiency through a graphical interface.
Test Design
Data Volume for the Test
Based on 1000 Warehouses, the main table data volumes are as follows:
- bmsql_order_line 300 million rows
- bmsql_stock 100 million rows
- bmsql_customer、bmsql_history、bmsql_oorder 30 million rows each
Host Resources
| Component Name | Model | Description |
|---|---|---|
| OPS Machine | ecs.g7.4xlarge | Used for installation and deployment |
| Compute Node (CN) | ecs.hfg7.4xlarge * 3 | 16 cores 64GB memory, Price: 2324 RMB/month |
| Data Node (DN) + Global Metadata Service (GMS) | ecs.i4.4xlarge * 3 | 16 cores 128GB memory + 3.5TB storage, Price: 3776 RMB/month |
Storage nodes require better IO, while compute nodes need stronger CPU power. By deploying them separately, we can improve the cost-performance ratio of resource utilization.
Stress Machine
| Component Name | Model | Description |
|---|---|---|
| Stress Machine | ecs.hfg7.6xlarge | 24c96g |
Test Method
Step 1: Prepare the Stress Machine
Deploy Benchmark-Boot, refer to the documentation: Stress Testing with Benchmark Boot
# Download the image
docker pull polardbx/benchmark-boot:latest

# Start the container
docker run -itd --name 'benchmark-boot' --privileged --net=host \
    -v /etc/localtime:/etc/localtime polardbx/benchmark-boot:latest \
    /usr/sbin/init

# Verify
curl http://127.0.0.1:4121/
For offline deployment, the benchmark-boot image can be downloaded using the OPS machine and then uploaded to a private repository.
Step 2: Prepare the PolarDB-X Instance for Stress Testing
Create a PolarDB-X instance, for detailed steps please refer to: Deploy by PXD
Instance creation parameters:
version: v1
type: polardbx
cluster:
  name: pxc-test
  no_logger: false
  gms:
    image: polardbx/polardbx-engine:v2.4.0_8.4.19
    engine: galaxy
    engine_version: "8.0"
    host_group: [192.168.1.102, 192.168.1.103, 192.168.1.104]
    resources:
      mem_limit: 16G
      cpu_limit: 8
  cn:
    image: polardbx/polardbx-sql:v2.4.0_5.4.19
    replica: 3
    nodes:
      - host: 192.168.1.102
      - host: 192.168.1.103
      - host: 192.168.1.104
    resources:
      mem_limit: 64G
      cpu_limit: 16
  dn:
    image: polardbx/polardbx-engine:v2.4.0_8.4.19
    engine: galaxy
    engine_version: "8.0"
    replica: 3
    nodes:
      - host_group: [192.168.1.105, 192.168.1.106, 192.168.1.107]
      - host_group: [192.168.1.106, 192.168.1.107, 192.168.1.105]
      - host_group: [192.168.1.107, 192.168.1.105, 192.168.1.106]
    resources:
      mem_limit: 50G
      cpu_limit: 16
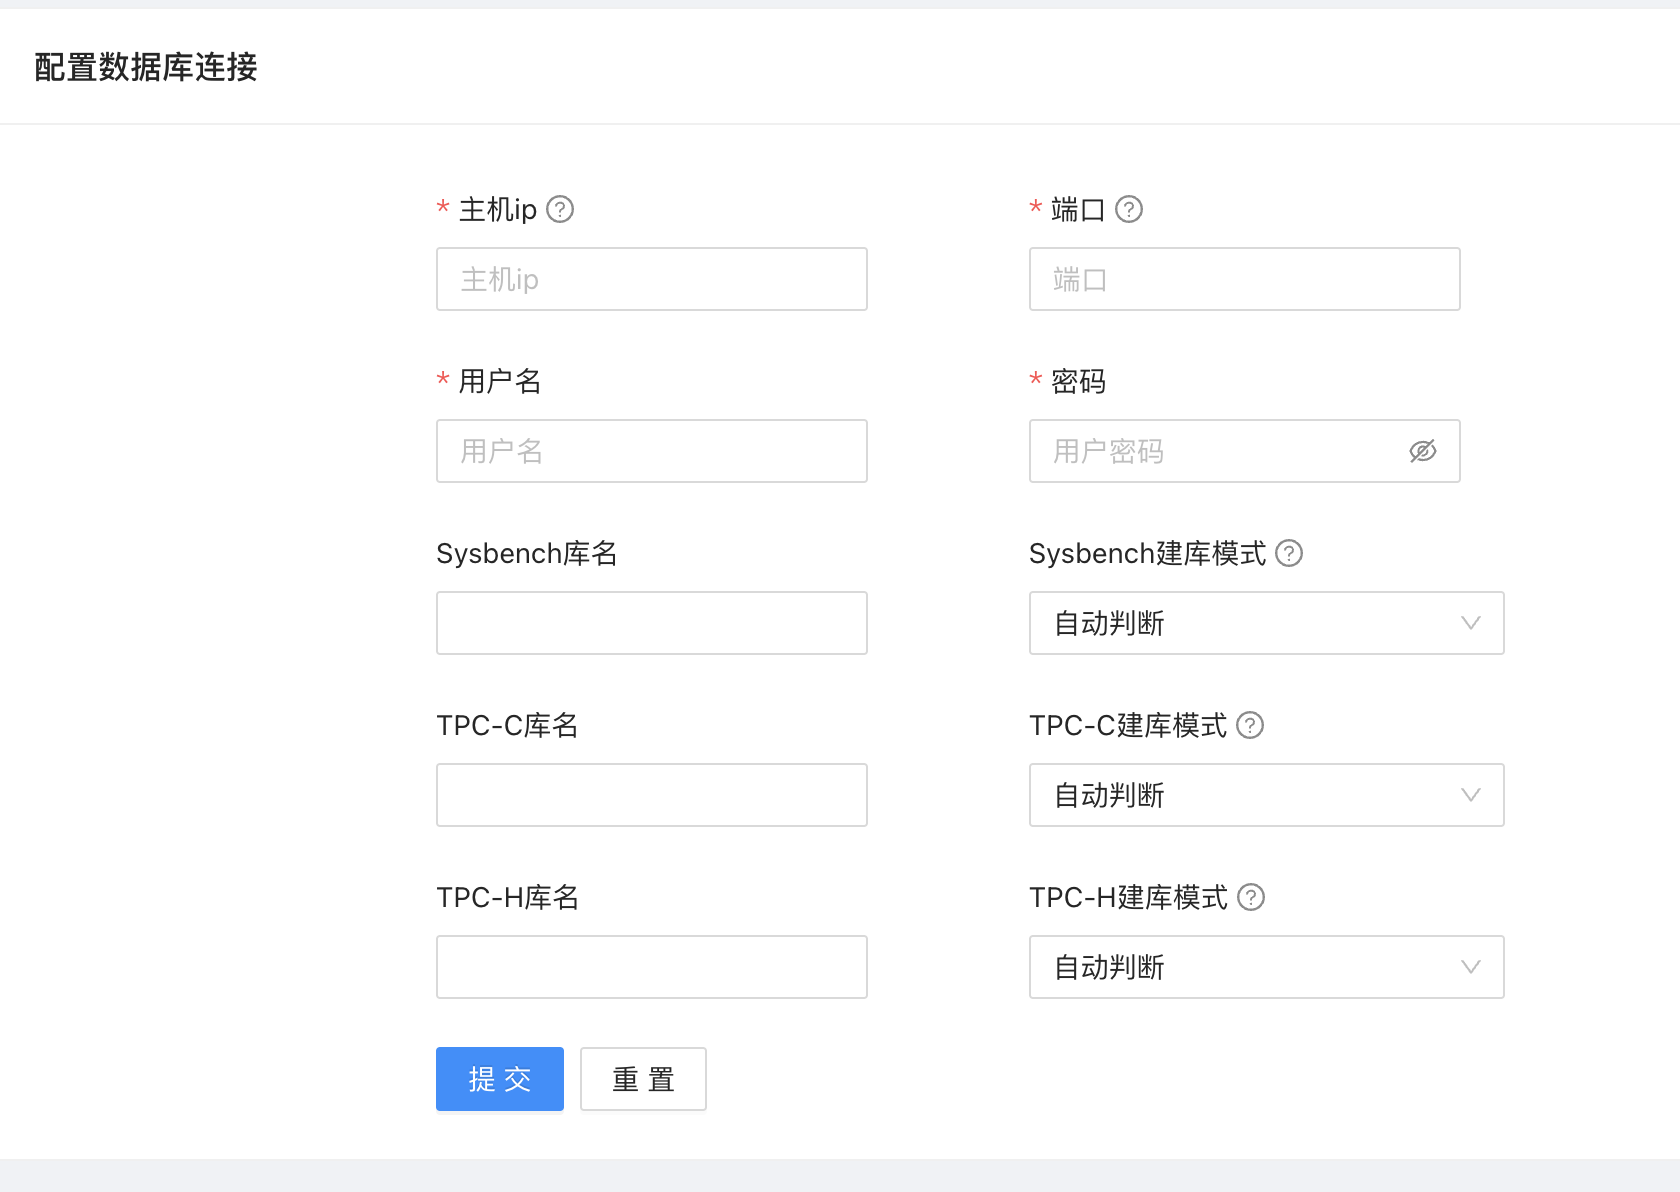
Verify that the instance can connect: open Benchmark-Boot, select Run Stress Test->Database Connection on the left side, enter the database connection information into Benchmark-Boot, and click "Submit".
Note: PolarDB-X provides multiple CN nodes. It is recommended to use load balancing equipment for access in a production environment. For POC testing scenarios, you can use the load balancing mechanism provided by benchmark-boot.
Configuration Example:
Enter multiple addresses for the host IP, like: 192.168.1.102:3306,192.168.1.103:3306,192.168.1.104:3306, and fill in -1 for the corresponding port
Step 3: Adjust Instance Parameters
Through Benchmark-Boot, select Run Stress Test->Database Connection on the left, set optimization parameters, and it is suggested to check all TP mode optimization parameters.
Step 4: Data Preparation for Stress Test
Create Database
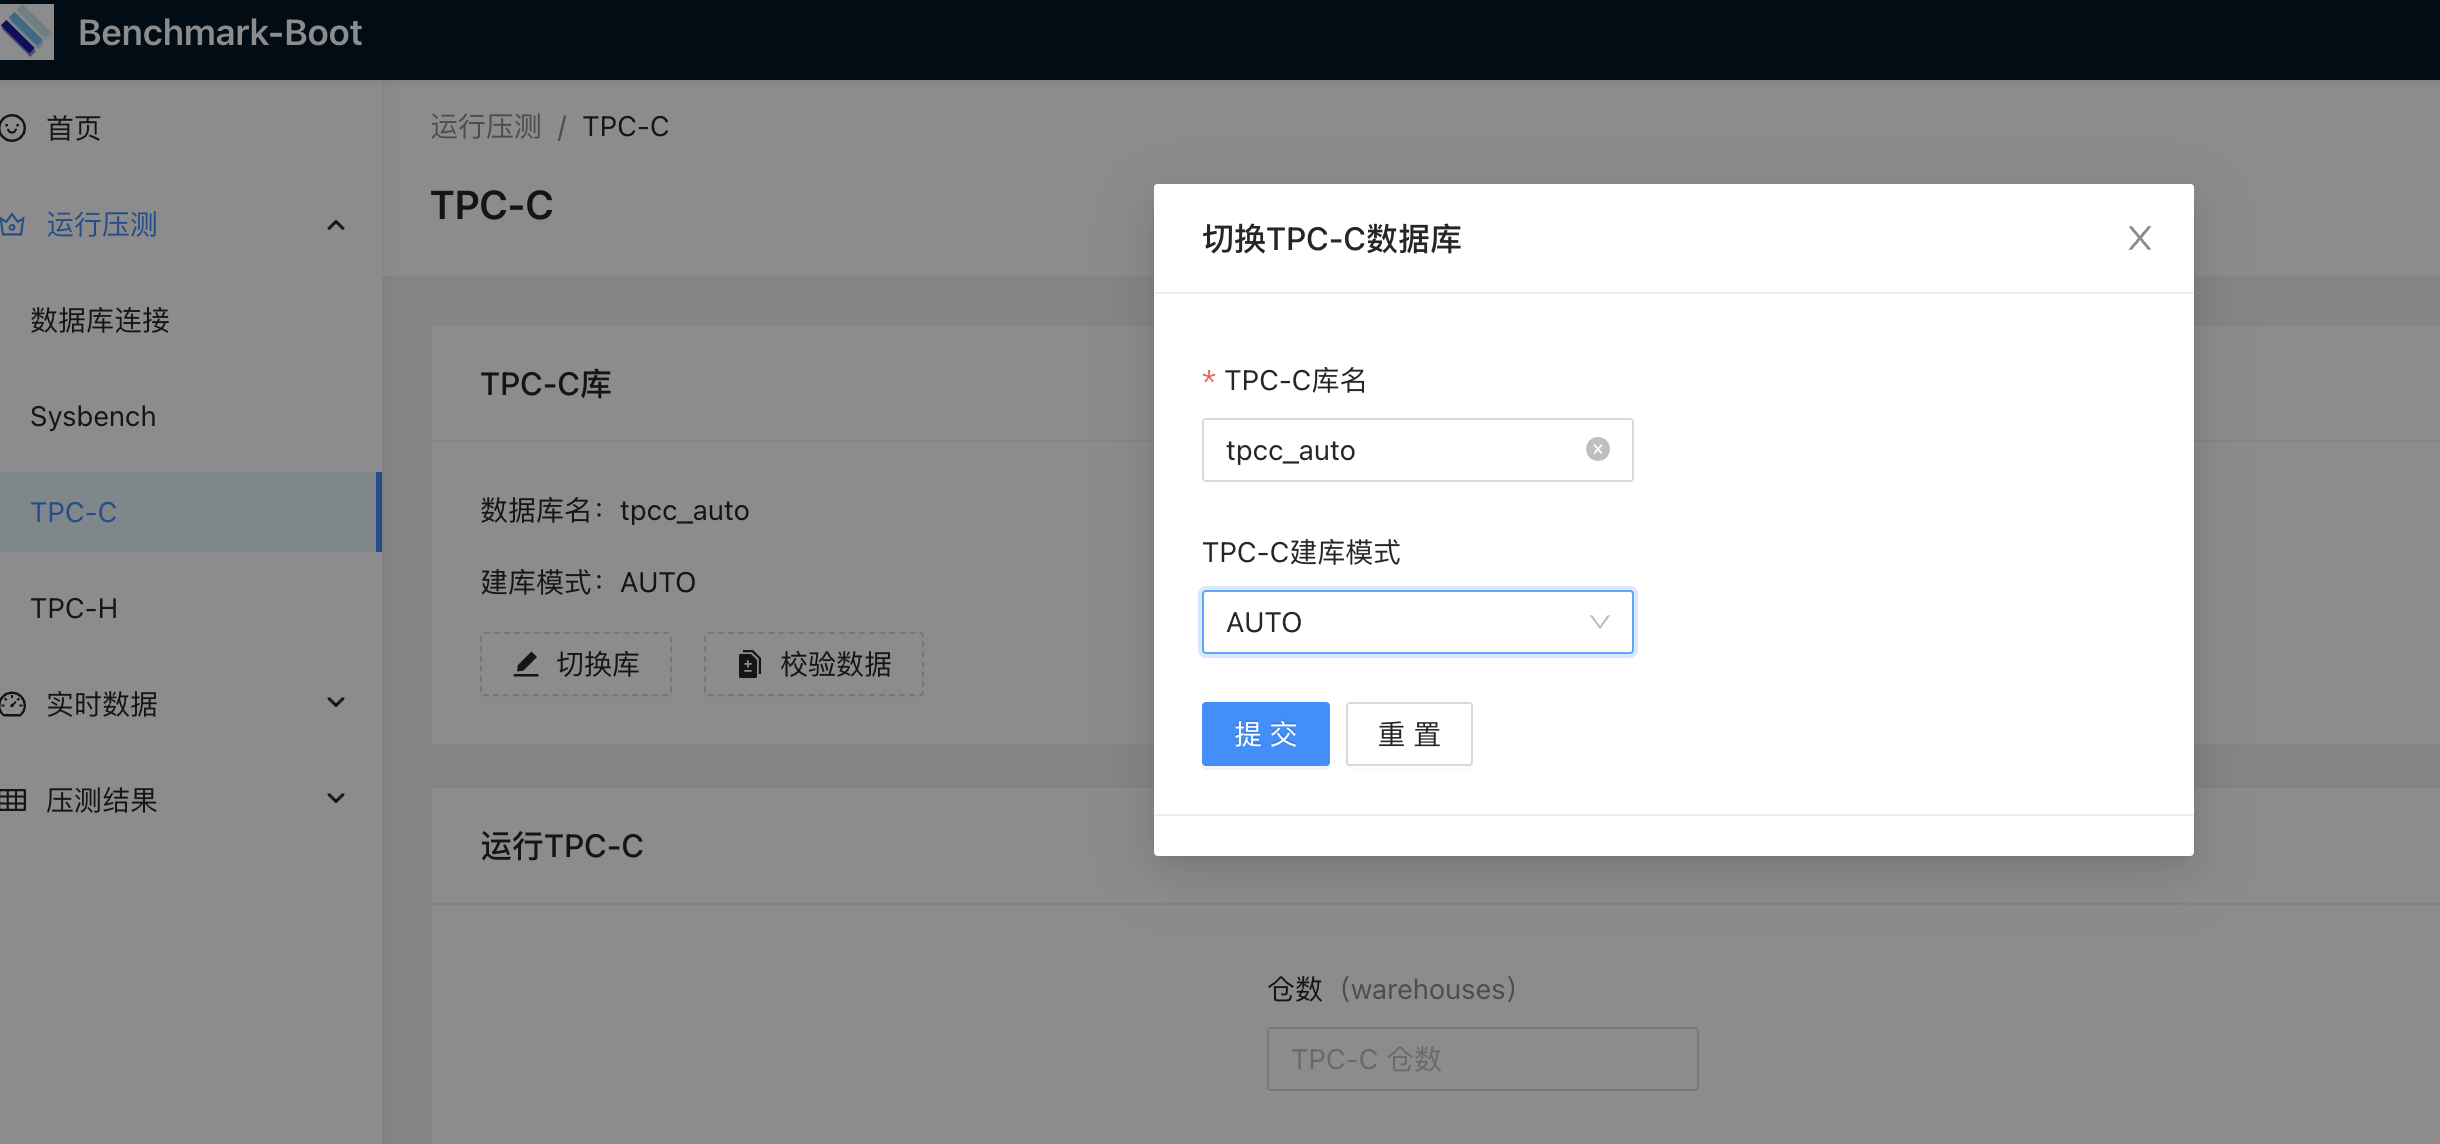
Open Benchmark-Boot, select Run Stress Test->TPC-C->Switch Database on the left, enter the database name tpcc_auto, choose AUTO mode, and submit.
Import Data
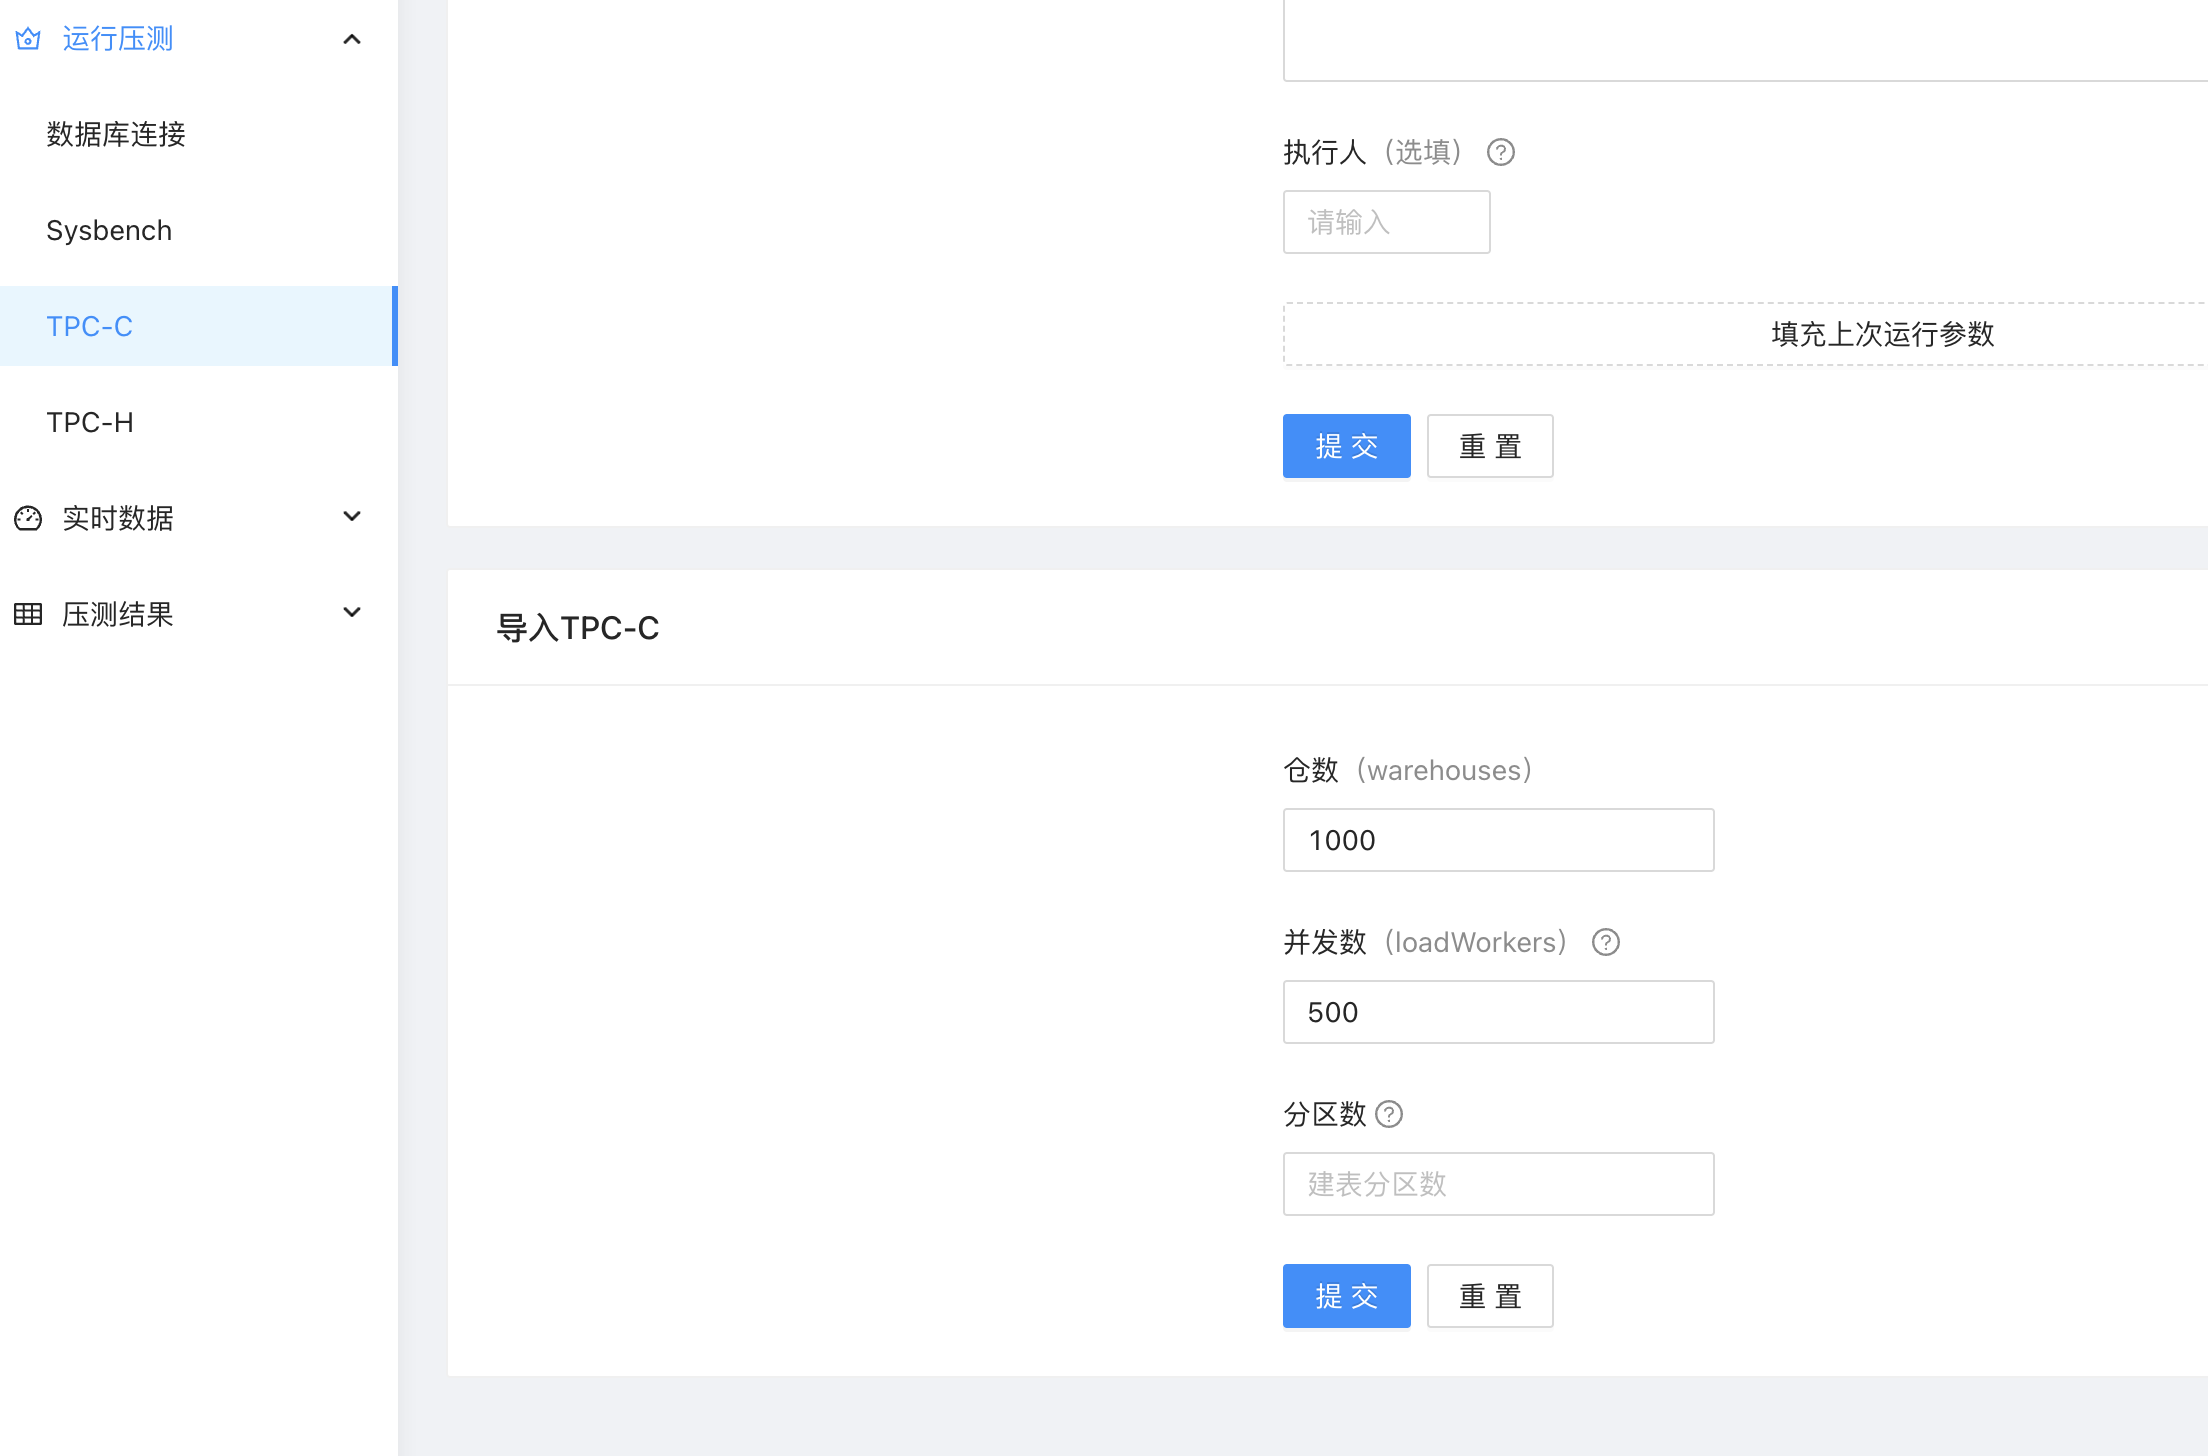
After creating the database, scroll down to the bottom of the page to import TPC-C data, with a warehouse count of 1000 and concurrency set to 500, and wait for the data preparation to complete.
Step 5: Execute the Stress Test
Select Run Stress Test->TPC-C->Run TPC-C on the left side, fill in the stress test parameters to proceed with the stress testing.
Test Results
| 200 threads | 400 threads | 600 threads | 800 threads | 1000 threads |
|---|---|---|---|---|
| 138091.09 | 157139.66 | 174417.79 | 176137.82 | 176861.03 |
01:42:57,724 [main] INFO   jTPCC : Term-00, warehouses=1000
01:42:57,724 [main] INFO   jTPCC : Term-00, terminals=1000
01:42:57,725 [main] INFO   jTPCC : Term-00, runMins=60
01:42:57,725 [main] INFO   jTPCC : Term-00, limitTxnsPerMin=0
01:42:57,725 [main] INFO   jTPCC : Term-00, terminalWarehouseFixed=true
01:42:57,725 [main] INFO   jTPCC : Term-00,
01:42:57,725 [main] INFO   jTPCC : Term-00, newOrderWeight=45
01:42:57,725 [main] INFO   jTPCC : Term-00, paymentWeight=43
01:42:57,725 [main] INFO   jTPCC : Term-00, orderStatusWeight=4
01:42:57,725 [main] INFO   jTPCC : Term-00, deliveryWeight=4
01:42:57,725 [main] INFO   jTPCC : Term-00, stockLevelWeight=4
01:42:57,725 [main] INFO   jTPCC : Term-00, newOrderRemotePercent=10
01:42:57,725 [main] INFO   jTPCC : Term-00, paymentRemotePercent=15
.......

02:43:02,186 [Thread-862] INFO   jTPCC : Term-00, Measured tpmC (NewOrders) = 176861.03
02:43:02,186 [Thread-862] INFO   jTPCC : Term-00, Measured tpmTOTAL = 393104.67
02:43:02,186 [Thread-862] INFO   jTPCC : Term-00, Session Start     = 2023-03-22 01:43:01
02:43:02,186 [Thread-862] INFO   jTPCC : Term-00, Session End       = 2023-03-22 02:43:02
02:43:02,186 [Thread-862] INFO   jTPCC : Term-00, Transaction Count = 23588042


