Log Collection
This article introduces how to enable the log collection feature for PolarDB-X databases in a k8s cluster.
Collected Content
Compute Node Logs
| Log | Path within Pod | Parsed |
|---|---|---|
| SQL Log | /home/admin/drds-server/logs/*/sql.log | Yes |
| Slow Log | /home/admin/drds-server/logs/*/slow.log | Yes |
| Error Log | /home/admin/drds-server/logs/*/tddl.log | No |
The asterisk (*) in the container path represents any directory name.
Data Node Logs
| Log | Path within Pod | Parsed |
|---|---|---|
| Audit Log | /data/mysql/tmp/*.alog | Yes |
| Slow Log | /data/mysql/data/mysql/slowlog*.CSV | Yes |
| Error Log | /data/mysql/log/alert.log | No |
The asterisk (*) in the container path represents any character.
Installing PolarDB-X LogCollector
PolarDB-X collects logs using Filebeat, which sends the raw logs to Logstash for parsing before being sent to the final storage endpoint.
Prerequisites
- A running K8s cluster is already prepared, and ensure the cluster version is >= 1.18.0.
- Helm 3 has been installed.
- PolarDB-X Operator version 1.2.2 or higher has been installed.
Helm Package Installation
First, create a namespace named polardbx-logcollector:
kubectl create namespace polardbx-logcollector
Execute the following command to install PolarDB-X LogCollector:
helm install --namespace polardbx-logcollector polardbx-logcollector https://github.com/polardb/polardbx-operator/releases/download/v1.7.0/polardbx-logcollector-1.6.2.tgz
You can also install it via the PolarDB-X Helm Chart repository:
helm repo add polardbx https://polardbx-charts.oss-cn-beijing.aliyuncs.com
helm install --namespace polardbx-logcollector polardbx-logcollector polardbx/polardbx-logcollector
With the default installation configuration, Filebeat is installed on k8s cluster machines as a DaemonSet. Each Filebeat Pod will occupy 500MB of memory and 1 CPU core by default; the Logstash Pod is deployed as a single instance, each occupying 1.5GB of memory and 2 CPU cores. The specific defaults can be seen in: values.yaml。
You should expect to see the following output:
polardbx-operator logcollector plugin is installed. Please check the status of components:

    kubectl get pods --namespace {{ .Release.Namespace }}

Now start to collect logs of  your polardbx cluster.
Viewing Logs
Enabling Log Collection
The log collection feature for PolarDB-X clusters is turned off by default. You can control the log collection on and off with the following commands:
Enable log collection for the CN node of the PolarDB-X instance:
kubectl patch --type='merge' pxc {pxc name} --patch '{"spec":{"config":{"cn":{"enableAuditLog":true}}}}' --type merge
Enable log collection for the CN node of the PolarDB-X instance:
kubectl patch --type='merge' pxc {pxc name} --patch '{"spec":{"config":{"cn":{"enableAuditLog":false}}}}' --type merge
Enable log collection for the DN node of the PolarDB-X instance:
kubectl patch --type='merge' pxc {pxc name} --patch '{"spec":{"config":{"dn":{"enableAuditLog":true}}}}' --type merge
Disable log collection for the DN node of the PolarDB-X instance:
kubectl patch --type='merge' pxc {pxc name} --patch '{"spec":{"config":{"dn":{"enableAuditLog":false}}}}' --type merge
Viewing Logs in Logstash Standard Output
PolarDB-X uses Logstash as the component for log parsing and reporting, and by default, it outputs logs to the standard console for users to verify if the log collection and parsing pipeline is working properly. Use the following command to view log collection:
kubectl logs -f {logstash pod name} -n polardbx-logcollector
Delivering Logs to Other Systems
Logstash supports a variety ofoutput plugins , and you can also develop your own output plugin , according to actual needs to deliver PolarDB-X logs to other systems for further analysis.
The output plugin configuration for Logstash is stored in a ConfigMap named logstash-pipeline under the polardbx-logcollector namespace. You can modify the output configuration of Logstash using the following command.
kubectl edit configmap logstash-pipeline -n polardbx-logcollector
The configuration of Logstash's

This section will use Elasticsearch as an example to explain how to configure Logstash for delivering PolarDB-X logs to an Elasticsearch cluster.
Delivering Logs to Elasticsearch
If you already have an Elasticsearch (ES) cluster in your environment, you can skip the "Creating Elasticsearch" section.
Creating Elasticsearch
Refer to the following documentation to quickly deploy a test ES cluster within a K8s cluster:
- Deploy ElasticSearch Operator
- Deploy ElasticSearch Cluster, where you need to obtain the endpoint, username, password, and certificates for the ES cluster.
The access certificate for the ES cluster can be obtained with the following command:
kubectl get secret quickstart-es-http-certs-public -o=jsonpath='{.data.ca\.crt}' - Deploy Kibana
Note: The above ES cluster is for testing purposes only. Please configure the ES cluster for production environments accordingly.
Updating Certificate Secrets
Skip this step if the ES cluster uses HTTP access.
If the ES cluster uses HTTPS access, you need to configure certificates. The certificate file (/usr/share/logstash/config/certs/ca.crt) is mounted into the Logstash Pod via the elastic-certs-public secret in the polardbx-logcollector namespace. Update the secret with this command:
kubectl edit secret elastic-certs-public -n polardbx-logcollector
Configuring Logstash Output
Prerequisites:
- An accessible ES cluster address within the k8s cluster;
- ES's automatic index creation feature enabled;
- An API Key or username and password created for the ES cluster;
- The ES cluster certificate, if using HTTPS. Enter the certificate content into the ES certificate secret, which is the elastic-certs-public in the polardbx-logcollector namespace, with the certificate file named ca.crt.
Update the Logstash output configuration with the following command:
kubectl edit configmap logstash-pipeline -n polardbx-logcollector
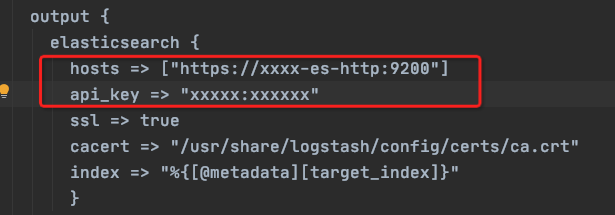
For example, here is a sample configuration for an ES cluster:
output {
  elasticsearch {
    hosts => ["https://quickstart-es-http.default:9200"]
    user => elastic
    password => sTF9B37N0jAF45Kn2Jwt874N
    ssl => true
    cacert => "/usr/share/logstash/config/certs/ca.crt"
    index => "%{[@metadata][target_index]}"
   }
}
- For more configuration options, visit Elastic Search Output Plugins Options
After enabling the Elasticsearch output plugin, remember to comment out the stdout output configuration.
Accessing Kibana
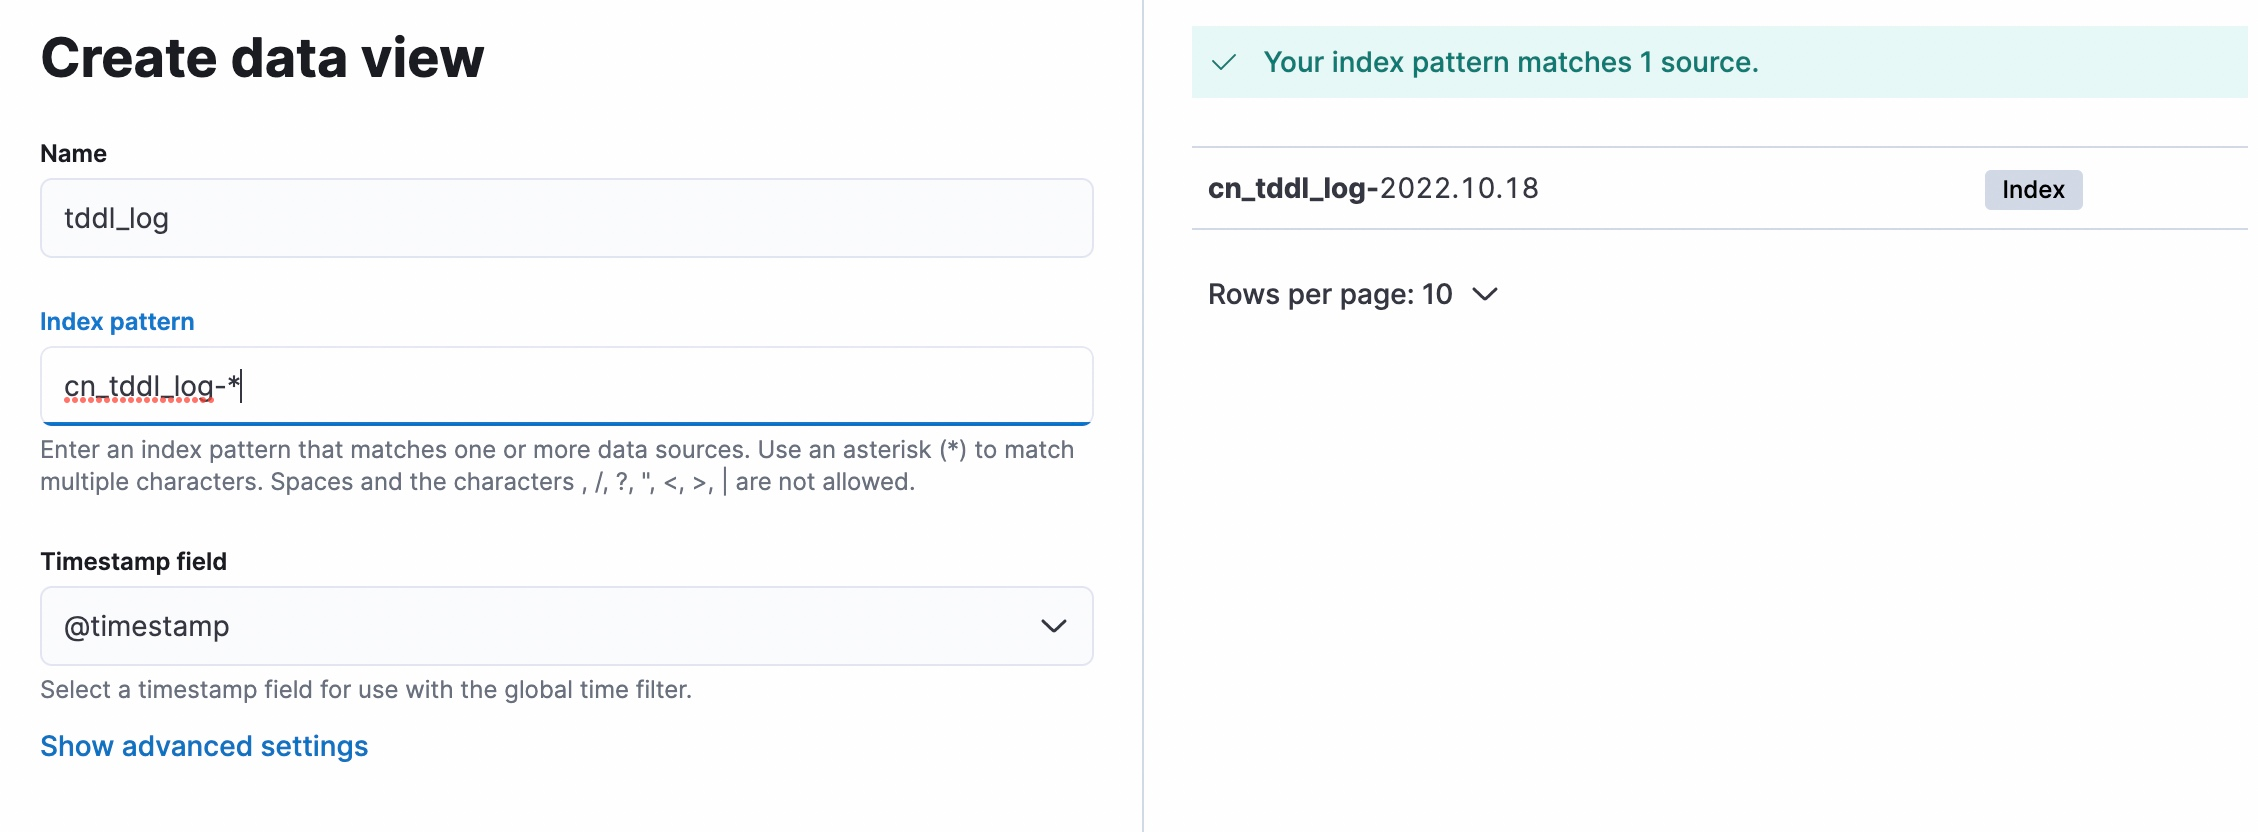
Following theDeploying Kibanaguide, log into Kibana and create three Index Patterns for log queries:
| Log Type | Index Pattern |
|---|---|
| SQL Log | cn_sql_log-* |
| Slow Log | cn_slow_log-* |
| Error Log | cn_tddl_log-* |
| DN Audit Log | dn_audit_log-* |
| DN Slow Log | dn_slow_log-* |
| DN Error Log | dn_error_log-* |
The creation of Kibana Index Patterns is shown in the following image:
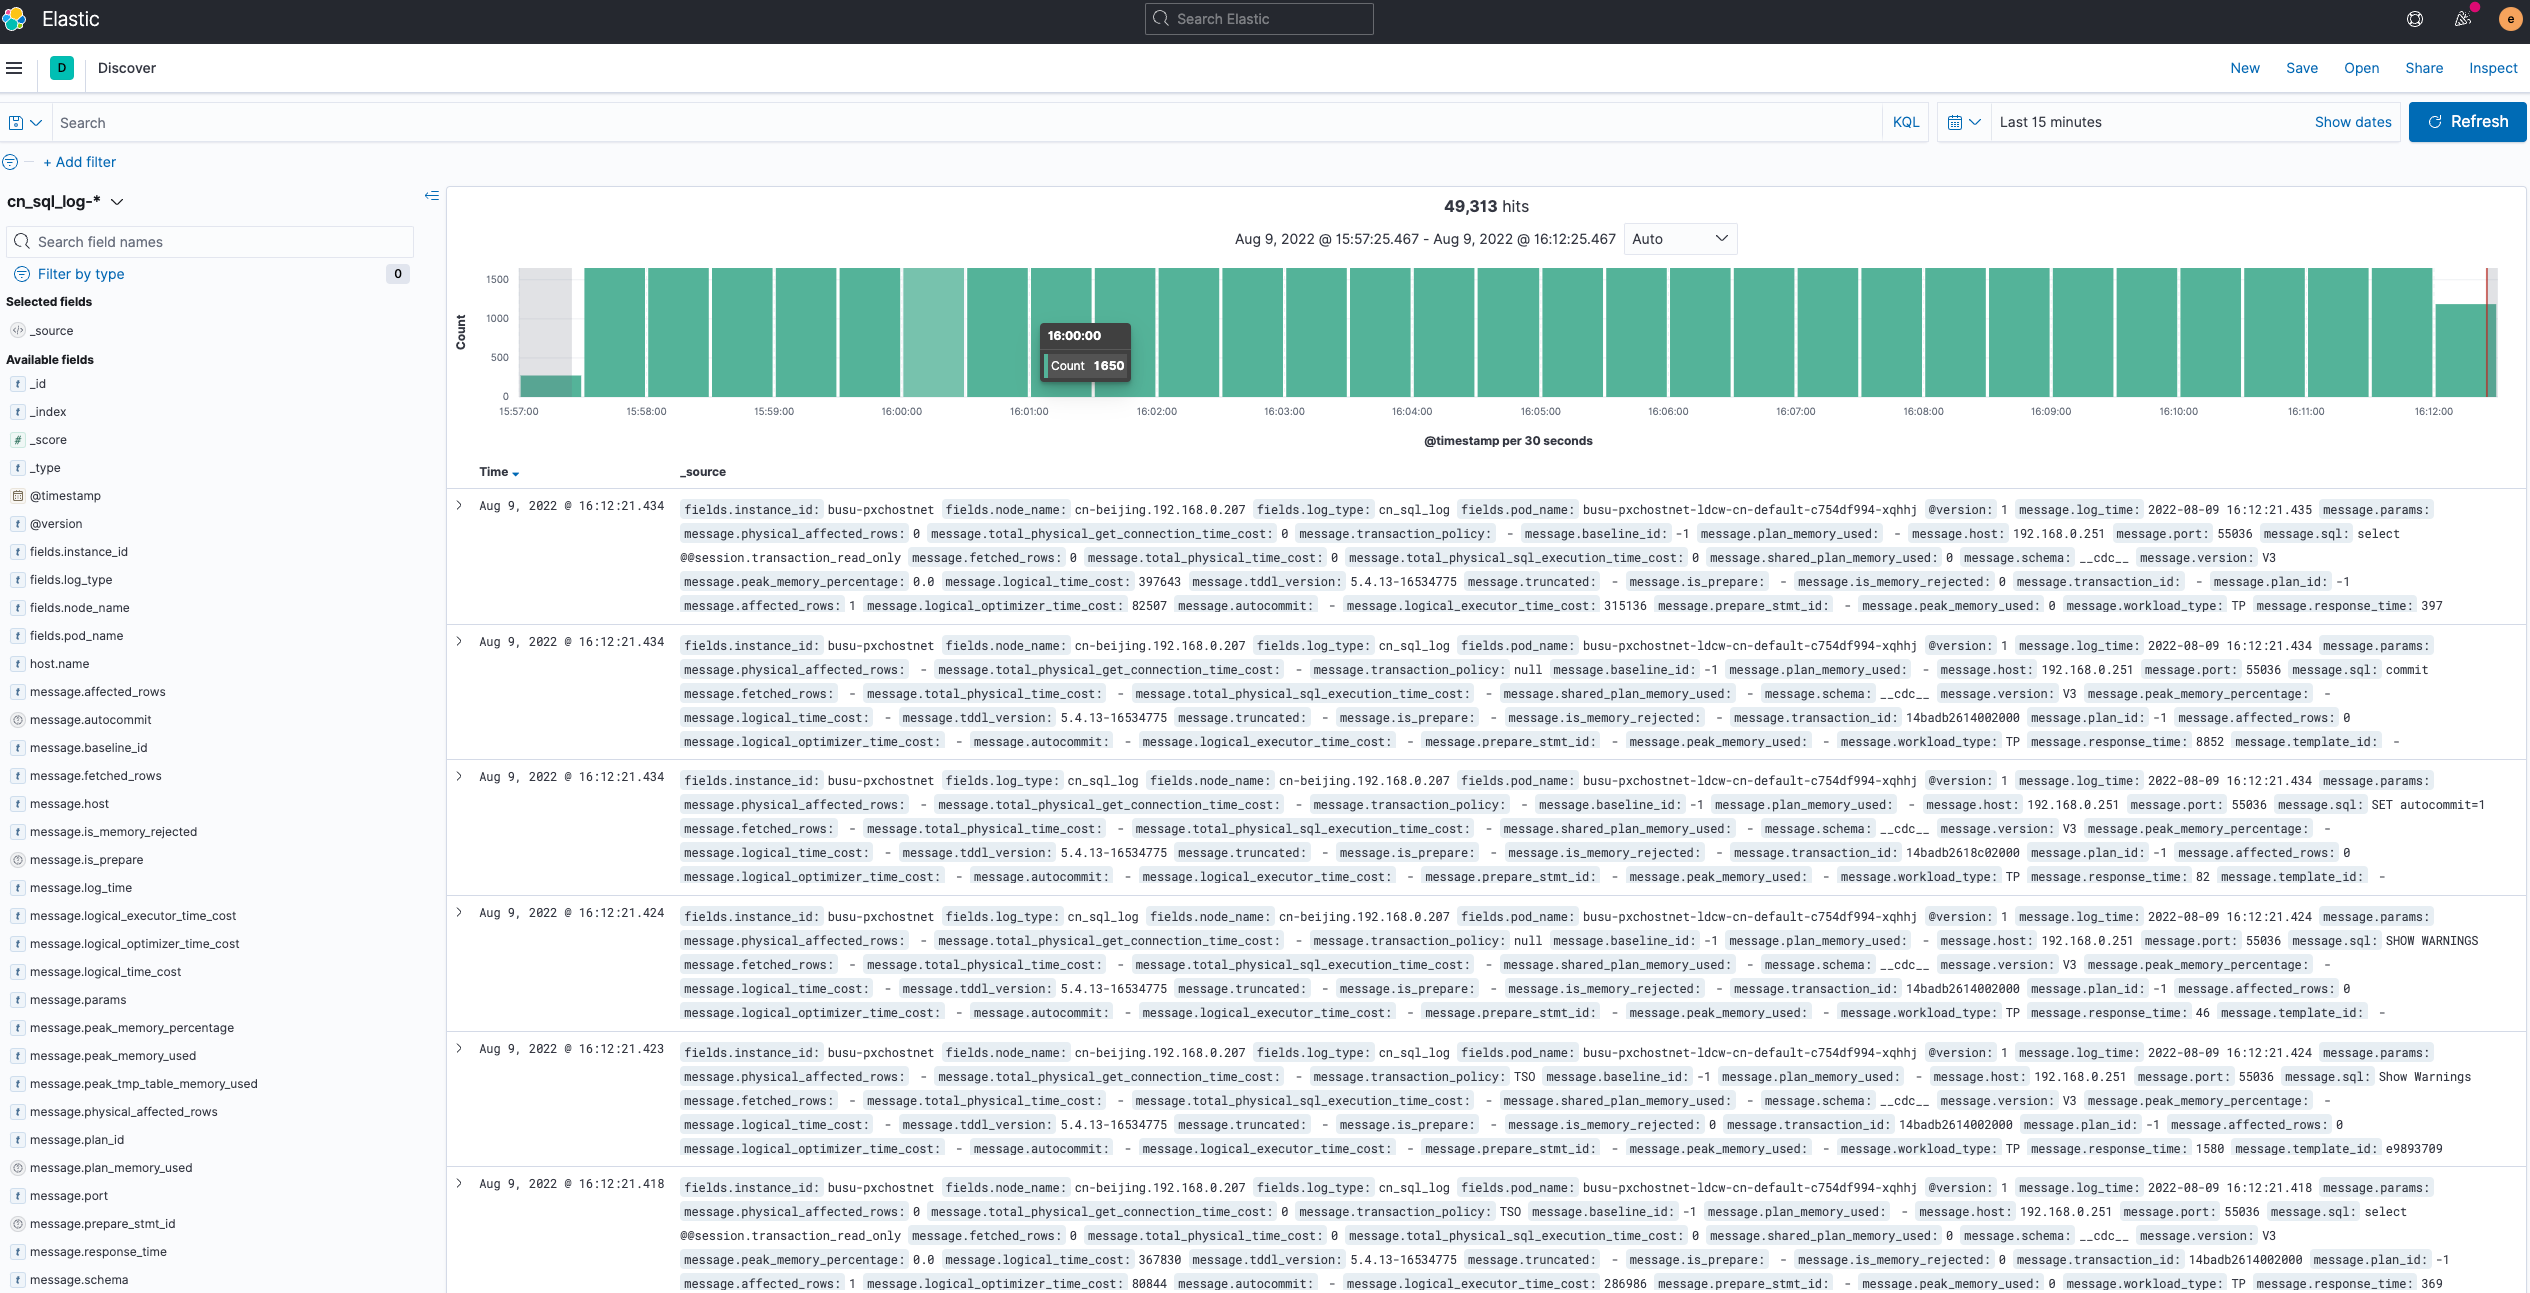
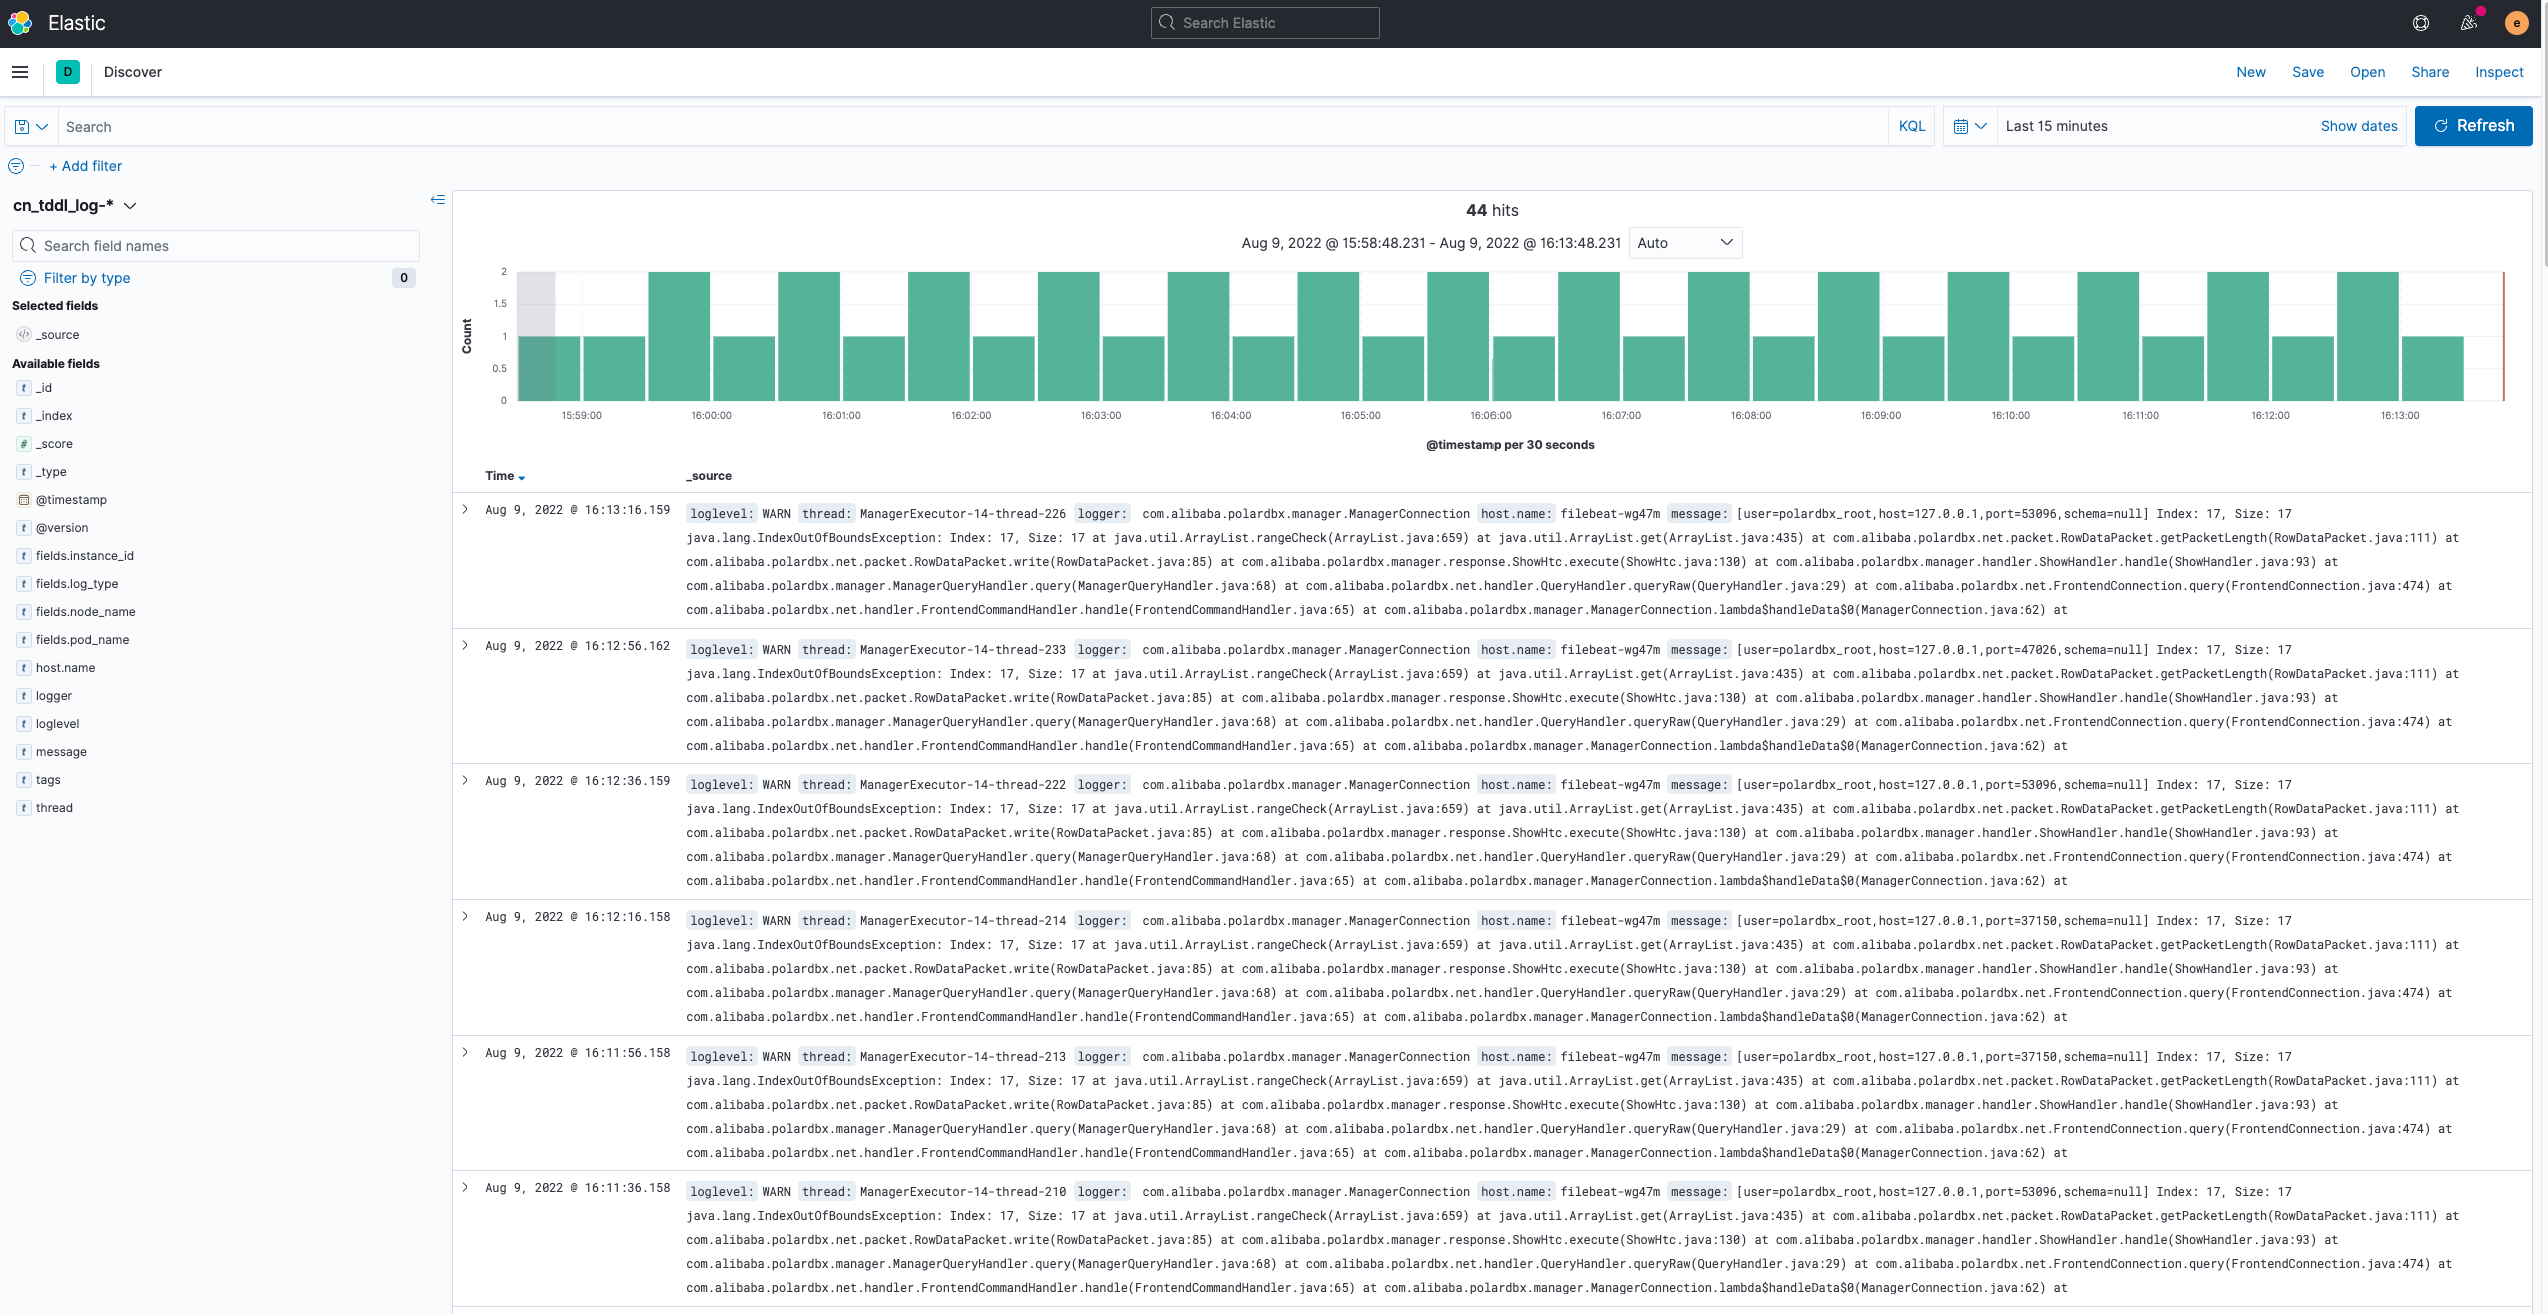
Log Effect Images
SQL Log
Error Log
Slow Log

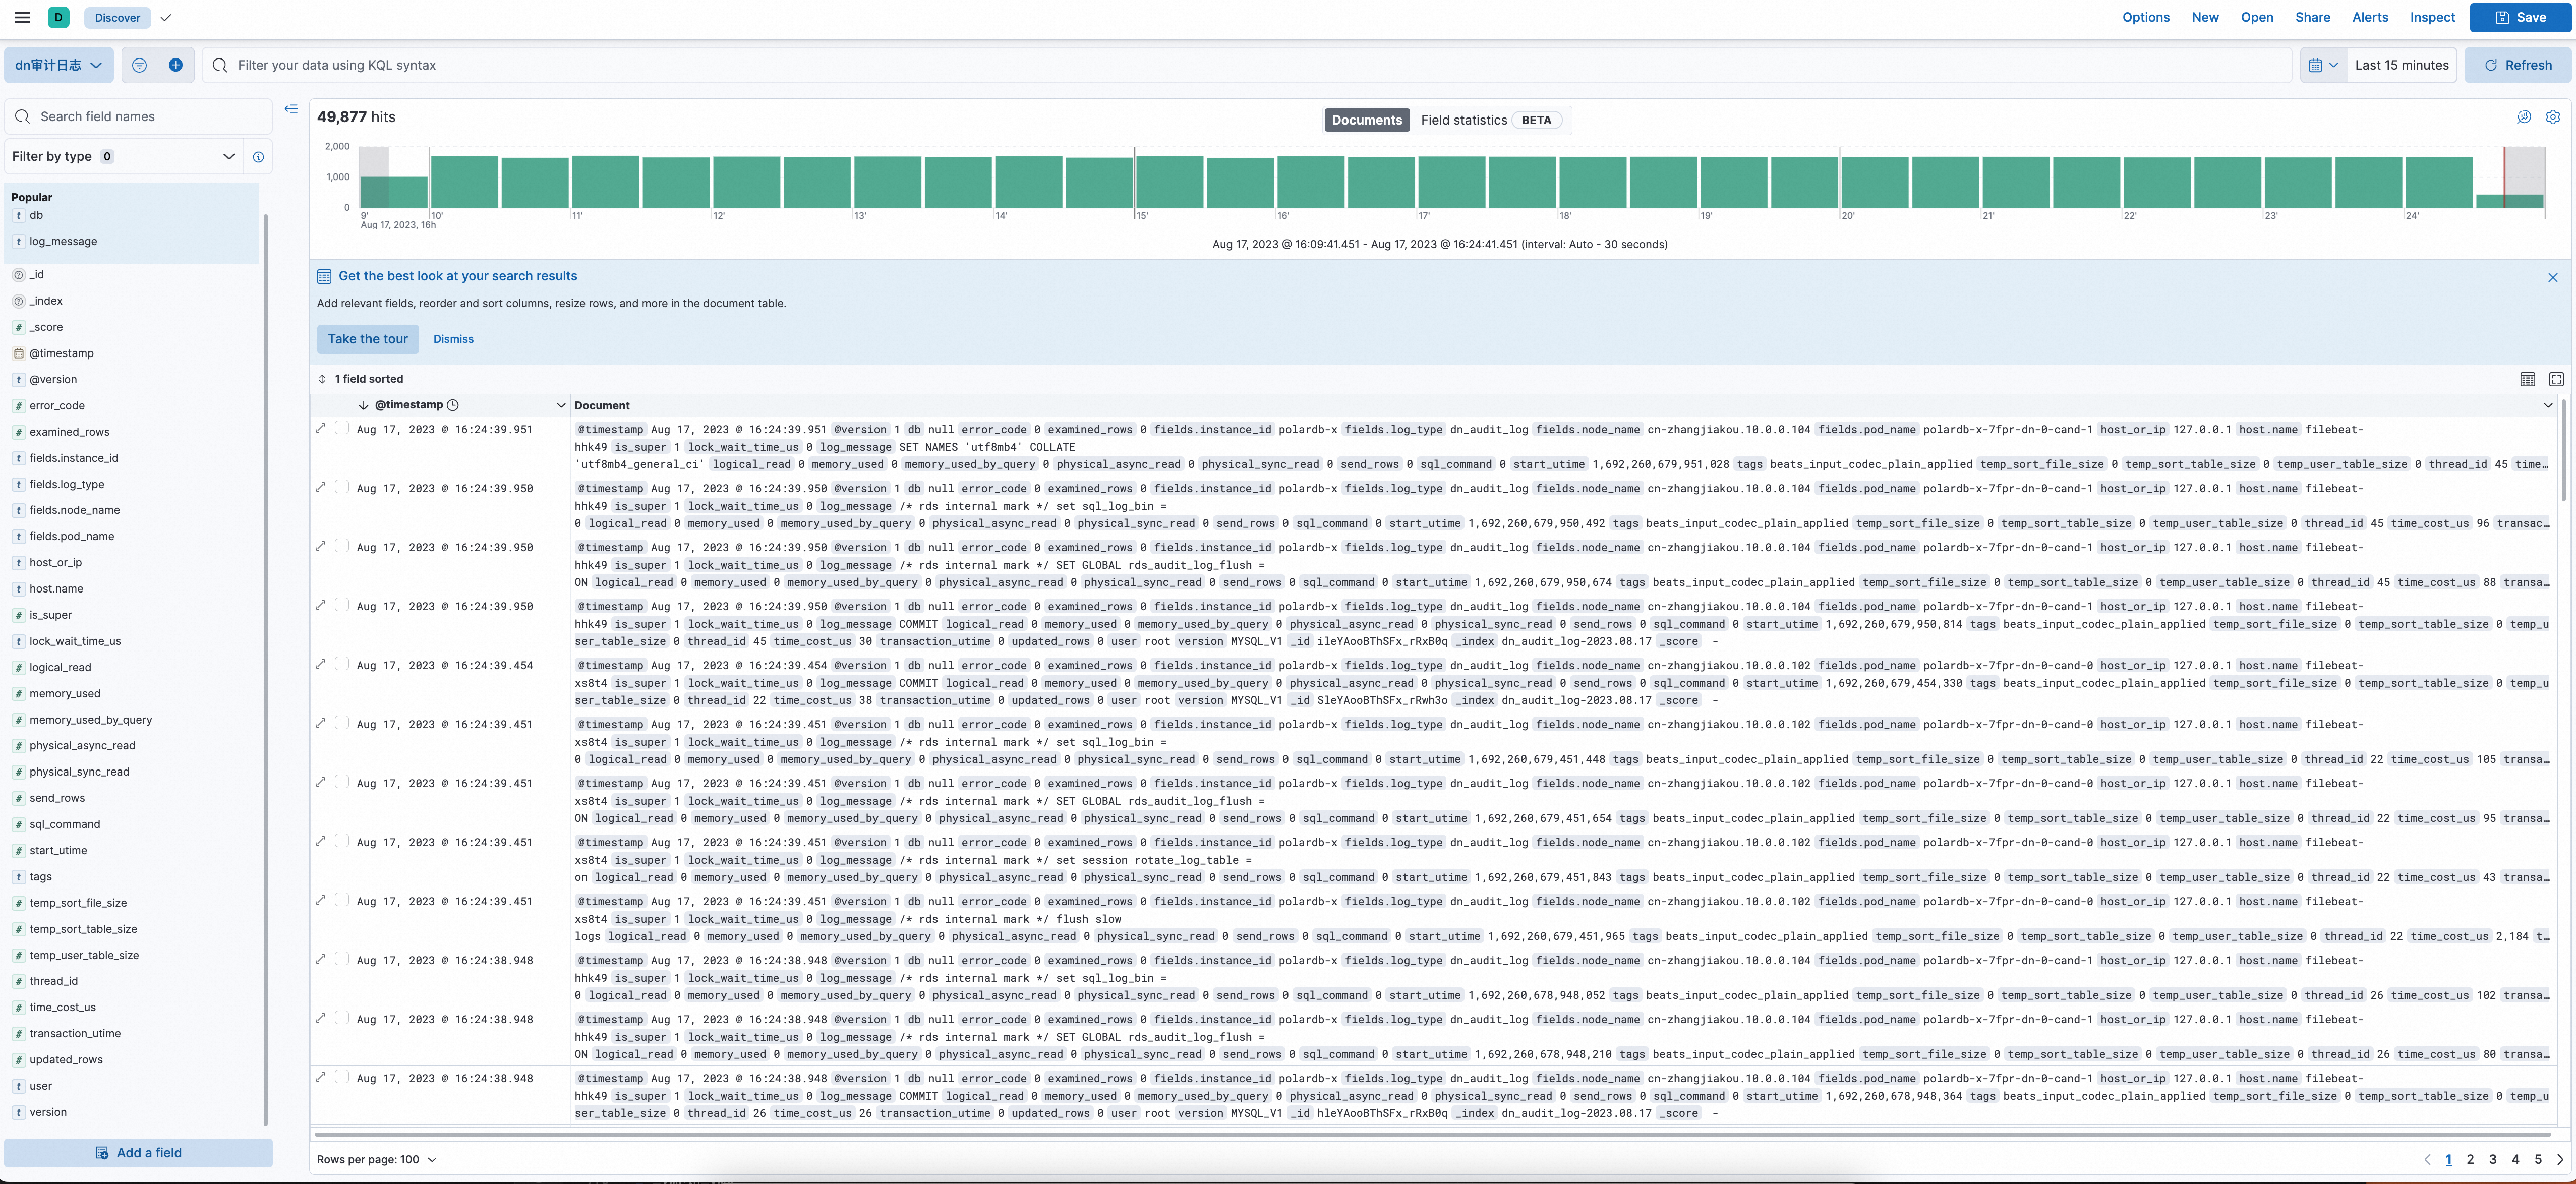
DN Audit Log
DN Error Log

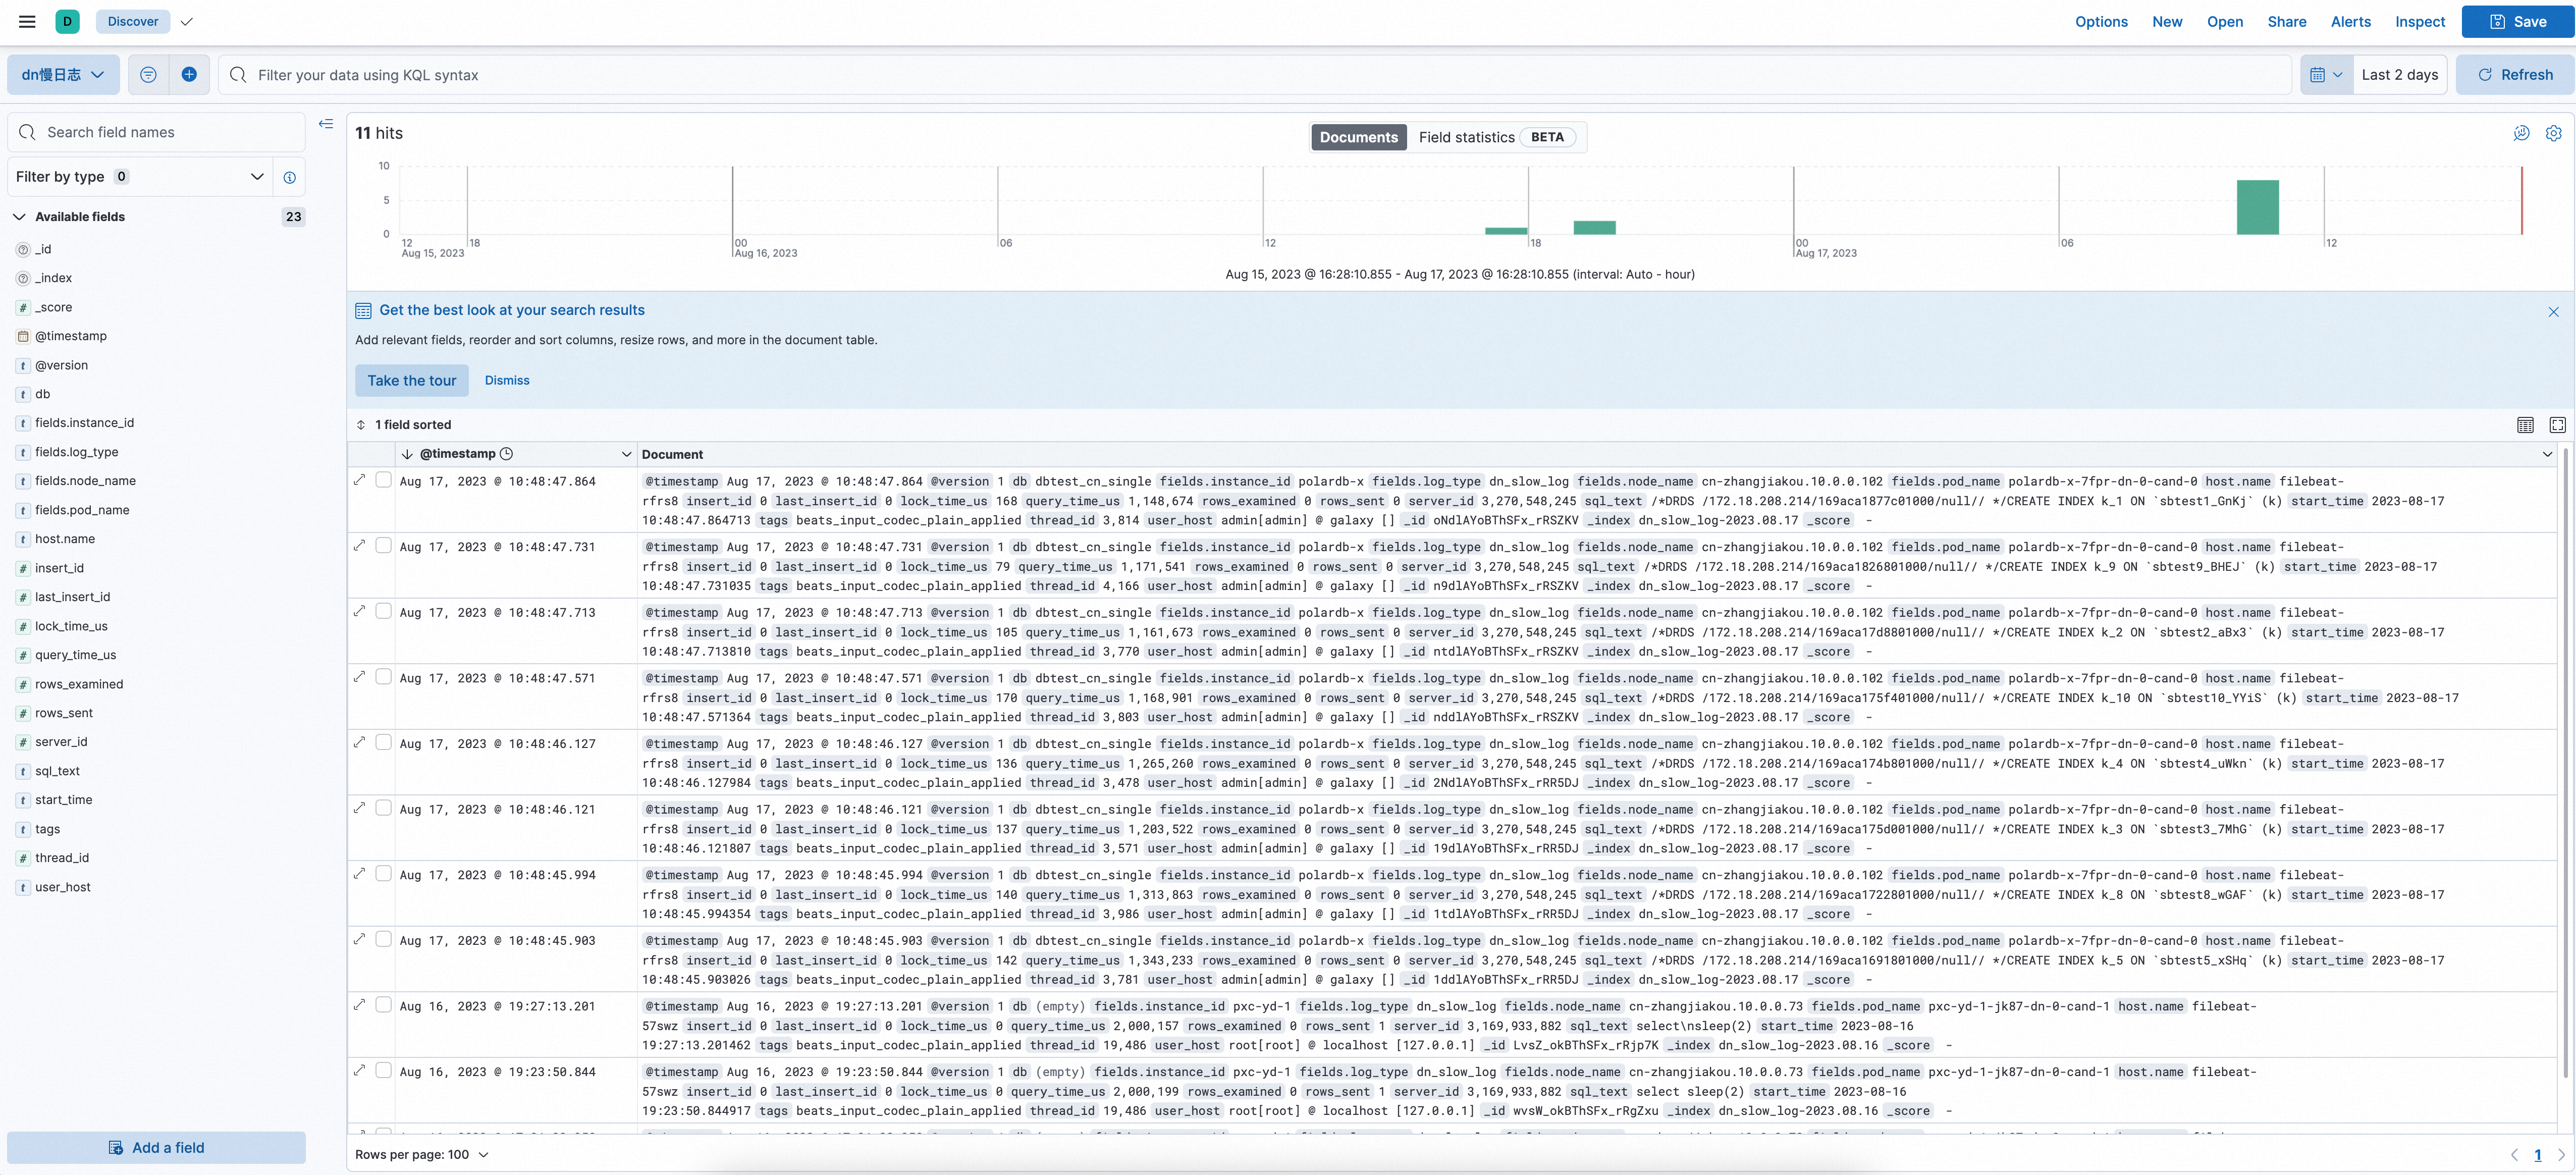
DN Slow Log
Additional Information
Introduction to values.yaml
Users can customize the installation configuration of polardbx-logcollector according to their actual situation. The path to values.yaml is charts/polardbx-logcollector/values.yaml, and the file provides detailed annotations for each configuration item
Introduction to Log Fields
View theIntroduction to Log Fields。
Recommendations for Resource Configuration and Performance Tuning
Resources
| Single-core logstash | Single-core filebeat |
|---|---|
| 5000 events/s | 12000 events/s |
To make full use of the CPU cores and avoid out-of-memory (OOM) issues, we need to properly configure memory resources, concurrency, cache size, etc.
Suggested Parameters to Adjust Based on Specific Scenarios
The filebeat.yml Configuration File for Filebeat
The ConfigMap name is filebeat-config. Parameters:
- Size of
harvester_buffer_sizefor SQL log configuration items - Configuration for
queue.mem - Interval for
prospector.scanner.check_interval - Duration for
close.reader.after_interval
Reference: Filebeat Configuration
The jvm.options Configuration File for Logstash
The ConfigMap name is logstash-config. Parameters:
- -Xms and -Xmx
The logstash.yml Configuration File for Logstash
The ConfigMap name is logstash-config. Parameters:
- pipeline.batch.size
- pipeline.workers
Reference: Logstash Configuration