Monitoring
This article explains how to enable the monitoring function for PolarDB-X databases in a K8s cluster.
Install PolarDB-X Monitor
PolarDB-X uses Prometheus and Grafana to monitor the PolarDB-X cluster. PolarDB-X Monitor integrates the kube-prometheus stack, and by installing PolarDB-X Monitor, you can deploy the required resources and components for monitoring with one click.
Prerequisites
- A running K8s cluster is already prepared, and ensure the cluster version is >= 1.18.0.
- Helm 3 is already installed.
- PolarDB-X Operator 1.2.0 or higher is already installed.
Helm Package Installation
First, create a namespace called polardbx-monitor:
kubectl create namespace polardbx-monitor
Install the PolarDBX Monitor CRD:
kubectl apply -f https://raw.githubusercontent.com/polardb/polardbx-operator/v1.2.1/charts/polardbx-operator/crds/polardbx.aliyun.com_polardbxmonitors.yaml
Note: If your PolarDB-X Operator 1.2.0 was installed directly through helm install, the PolarDBXMonitor CRD will be installed by default, and you can skip this step. If your PolarDB-X Operator was upgraded from version 1.1.0 or lower through helm upgrade, you need to execute the following command to install manually:
Execute the following command to install PolarDB-X Monitor:
helm install --namespace polardbx-monitor polardbx-monitor https://github.com/polardb/polardbx-operator/releases/download/v1.2.1/polardbx-monitor-1.2.1.tgz
You can also install via the PolarDB-X Helm Chart repository:
helm repo add polardbx https://polardbx-charts.oss-cn-beijing.aliyuncs.com
helm install --namespace polardbx-monitor polardbx-monitor polardbx/polardbx-monitor
Note: Installing Prometheus and Grafana this way uses default configurations for a quick experience. If deploying in a production cluster, you can refer to Customize PolarDB-X Monitor Configuration.
Note: If you are installing PolarDB-X Monitor on minikube, you may encounter resource shortages that prevent component creation. You can refer to Configure Specifications for Prometheus and Grafana to adjust component specifications.
You should expect to see the following output:
polardbx-operator monitor plugin is installed. Please check the status of components:

    kubectl get pods --namespace {{ .Release.Namespace }}

Now start to monitor your polardbx cluster.
After PolarDB-X Monitor is installed, it will create components such as Prometheus and Grafana in the polardbx-monitor namespace of your K8s cluster to monitor the PolarDB-X within K8s. Use the following command to check whether the relevant components are functioning properly and confirm that all pods are in the Running state.
kubectl get pods -n polardbx-monitor
Enable PolarDB-X Monitoring
The monitoring collection function for the PolarDB-X cluster is disabled by default. You need to create a PolarDBXMonitor object for the PolarDBXCluster that you want to monitor to enable it.
kubectl apply -f polardbx-monitor.yaml
The yaml description for polardbx-monitor.yaml is as follows:
apiVersion: polardbx.aliyun.com/v1
kind: PolarDBXMonitor
metadata:
  name: quick-start-monitor
spec:
  clusterName: quick-start
  monitorInterval: 30s
  scrapeTimeout: 10s
- spec.clusterName: The name of the PolarDB-X cluster for which monitoring is to be enabled.
- spec.monitorInterval: The frequency of monitoring data collection, default is 30s.
- spec.scrapeTimeout: The timeout for monitoring data collection, default is 10s.
Access Grafana Dashboard
By default, execute the following command to forward the Grafana port to local:
kubectl port-forward svc/grafana -n polardbx-monitor 3000
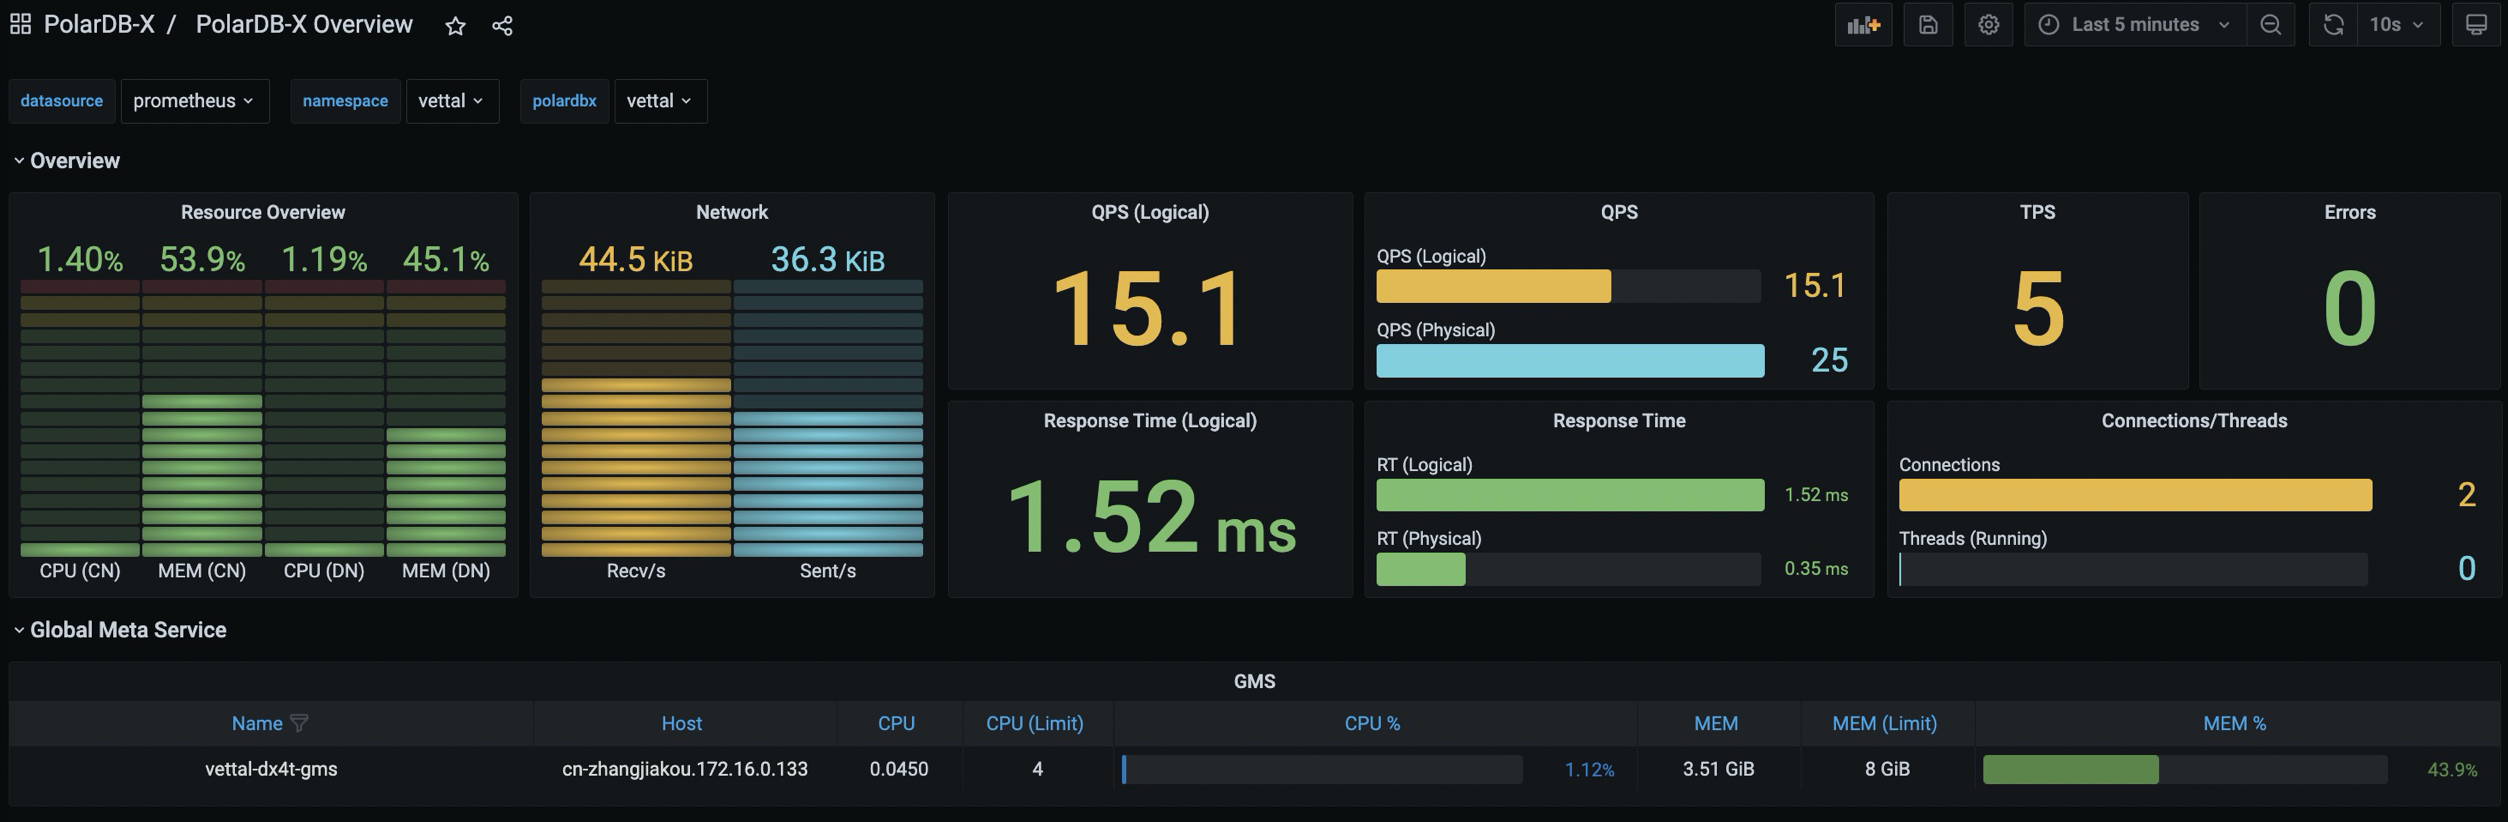
Enter the browser: http://localhost:3000, and you will have access to the PolarDB-X Dashboard. The default username and password are both admin.
Note: Since Grafana's configuration is stored in a ConfigMap, any password changes or new Dashboards you add in Grafana will not be persistent. If the Grafana Pod is rebuilt, these configurations will be lost. Please make sure to save them in advance.
Continuing. If your K8s cluster supports LoadBalancer, you can configure a LoadBalancer for the Grafana Service for access, see: Configure LoadBalancer.
If there are multiple PolarDB-X Clusters in your K8s cluster, you can switch between Namespace and PolarDB-X Cluster using the dropdown box on the Grafana page.
Access Prometheus
By default, execute the following command to forward the Prometheus port to local:
kubectl port-forward svc/prometheus-k8s -n polardbx-monitor 9090
Enter the browser: http://localhost:9090, and you will have access to the Prometheus page.
If your K8s cluster supports LoadBalancer, you can configure a LoadBalancer for the Prometheus Service for access, see: Configure LoadBalancer.
Customize Prometheus and Grafana Configuration
The helm chart for PolarDB-X Monitor uses the default configuration for Prometheus and Grafana. If you want to change the related configurations, you can install or upgrade PolarDB-X Monitor with the following command, overriding the default configuration with a values.yaml file.
helm install --namespace polardbx-monitor polardbx-monitor polardbx-monitor-1.2.0.tgz -f values.yaml
Or:
helm upgrade --namespace polardbx-monitor polardbx-monitor polardbx-monitor-1.2.0.tgz -f values.yaml
The values.yaml file contains configuration items for Prometheus and Grafana. Below are configuration examples for common scenarios, and a detailed list of configurations can be found here: values.yaml.
Configure LoadBalancer
If your K8s cluster supports LoadBalancer, you can specify the following configuration when installing or upgrading PolarDB-X Monitor by using the -f parameter:
monitors:
  grafana:
    serviceType: LoadBalancer
  prometheus:
    serviceType: LoadBalancer
Persist Monitoring Data
The default configuration creates Prometheus clusters whose monitoring data is not persistent, which poses a risk of data loss. You can specify a directory for data persistence in your values.yaml file as follows:
monitors:
  prometheus:
    persist: true
    # The storage class supported within the K8s cluster
    storageClassName: ssd
    # The size of the storage space
    storageRequest: 100G
Configure Specifications for Prometheus and Grafana
In the default configuration, the Prometheus cluster consists of one node with a limit of 8 CPU cores and 16 GB of memory, and Grafana consists of one node with a limit of 4 CPU cores and 8 GB of memory. You can modify the specifications and number of nodes for the Prometheus and Grafana clusters by using the following configuration options:
monitors:
  grafana:
    resources:
      requests:
        cpu: 1000m
        memory: 2Gi
      limits:
        cpu: 2000m
        memory: 8Gi
  prometheus:
    resources:
      requests:
        cpu: 1000m
        memory: 2Gi
      limits:
        cpu: 2000m
        memory: 8Gi