Sysbench Test Report
Background Information
Sysbench is an open-source, modular, cross-platform, multi-threaded benchmarking tool that can perform database performance testing in areas like CPU, memory, threads, and I/O.
Benchmark Boot is a one-stop benchmarking platform developed for PolarDB-X, currently supporting benchmarks including Sysbench, TPC-C, and TPC-H, enhancing testing efficiency through a graphical interface.
Test Design
Data Volume for the Test
The sysbench data includes 16 tables, each with a volume of 10 million records.
Test Cases
Sysbench evaluates the performance of PolarDB-X in a centralized standard edition single-table scenario.
Host Resources
| Component Name | Model | Description |
|---|---|---|
| OPS Machine | ecs.g7.4xlarge | For installation and deployment |
| Data Node (DN) | ecs.i4.8xlarge * 3 | 32c256g + 7TB storage Unit price: 7452 CNY/month |
The centralized standard edition of PolarDB-X only requires deployment of storage nodes DN, without the need for additional compute nodes CN.
Stress Test Machines
| Component Name | Model | Description |
|---|---|---|
| Stress Test Machine | ecs.hfg7.6xlarge | 24c96g |
Test Methodology
Step 1: Prepare the Stress Test Machine
Deploy Benchmark-Boot, refer to the documentation: Using Benchmark Boot for Stress Testing
# Download the image
docker pull polardbx/benchmark-boot:latest

# Start the container
docker run -itd --name 'benchmark-boot' --privileged --net=host \
    -v /etc/localtime:/etc/localtime polardbx/benchmark-boot:latest \
    /usr/sbin/init

# Verification
curl http://127.0.0.1:4121/
For offline deployment, the benchmark-boot image can be downloaded using the OPS machine and then uploaded to a private repository.
Step 2: Prepare the PolarDB-X Instance for Stress Testing
Create a PolarDB-X instance. For detailed operation steps, please refer to: Deploy by PXD
Instance creation parameters:
version: v1
type: polardbx
cluster:
  name: pxc_test_standard
  dn:
    image: registry:5000/polardbx-engine-2.0:latest
    replica: 1
    nodes:
      - host_group: [10.0.3.244, 10.0.3.245, 10.0.3.246]
    resources:
      mem_limit: 80G
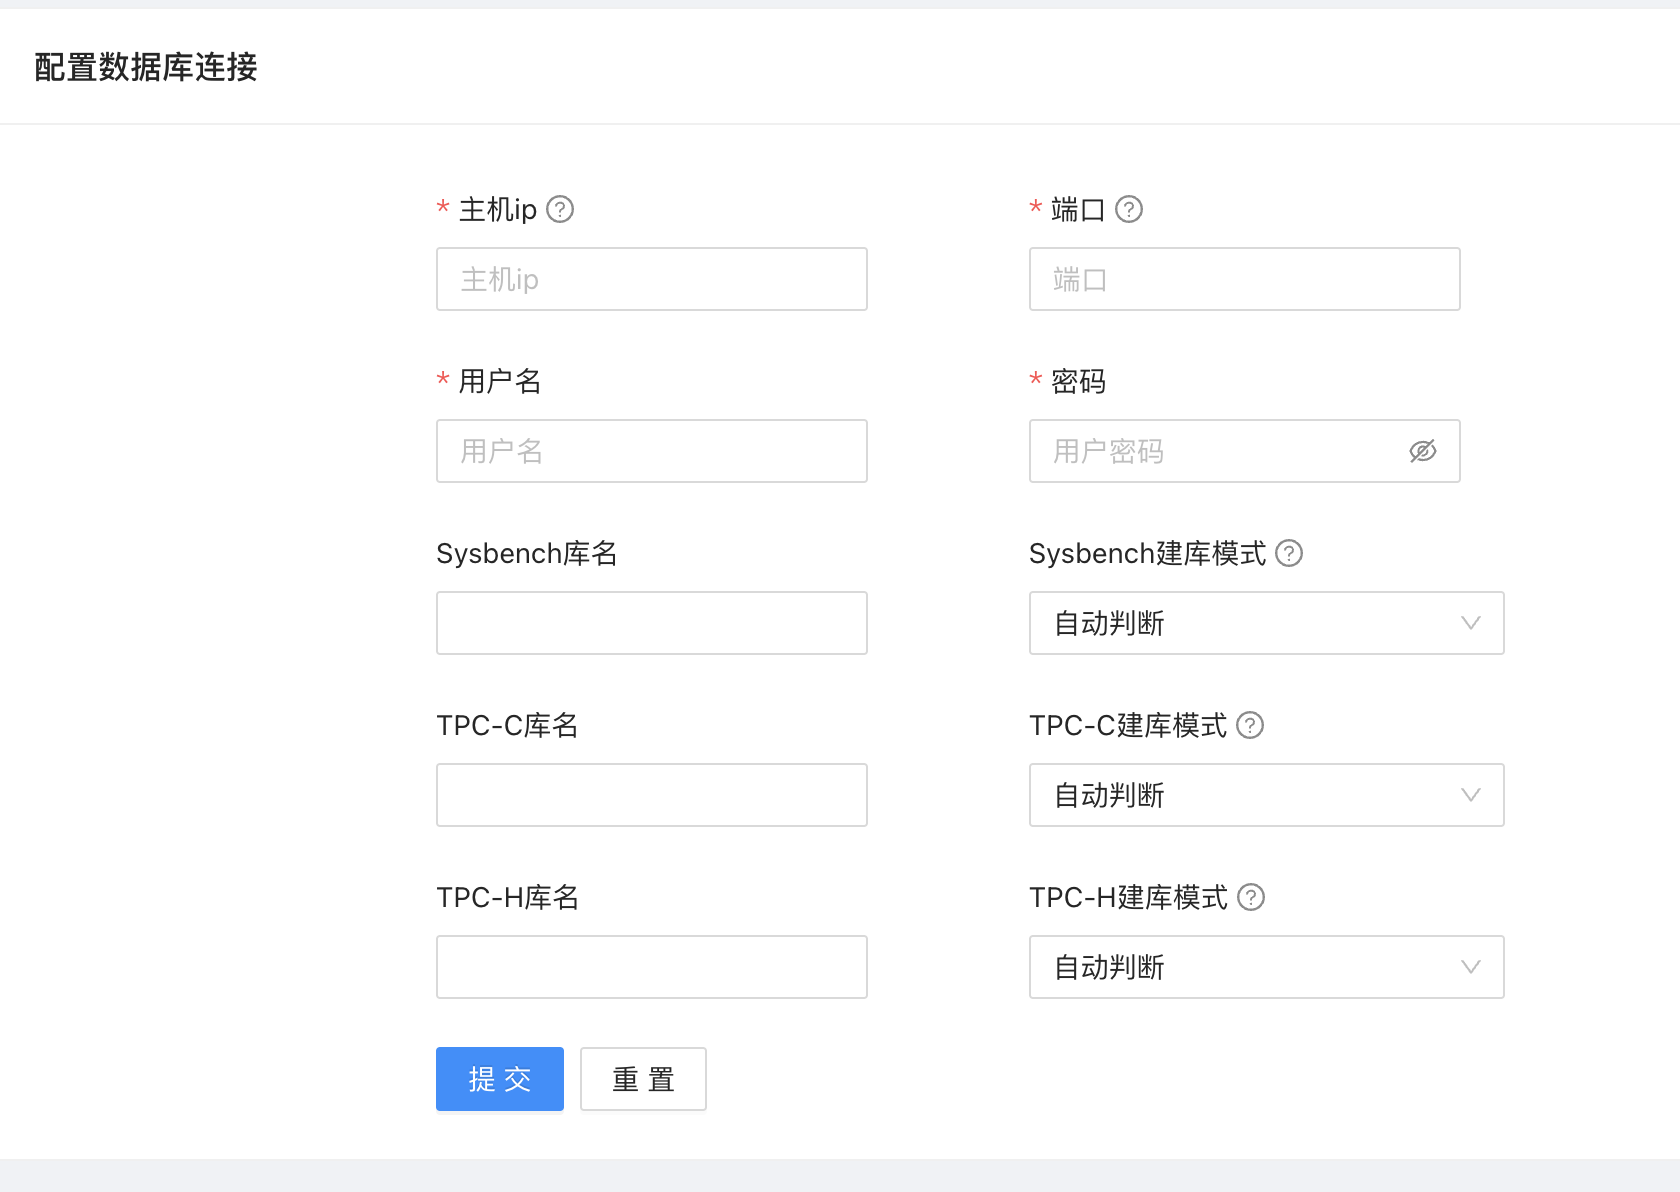
Verify that the instance is connectable. Open Benchmark-Boot, select 'Run Stress Test' -> 'Database Connection' on the left, fill in the database connection information into Benchmark-Boot, and click 'Submit'.
Step 3: Adjust Instance Parameters
The PolarDB-X instance created by default through PXD uses a built-in my.cnf parameter template:
sync_binlog = 1
innodb_flush_log_at_trx_commit = 1
Step 4: Prepare Data for Stress Testing
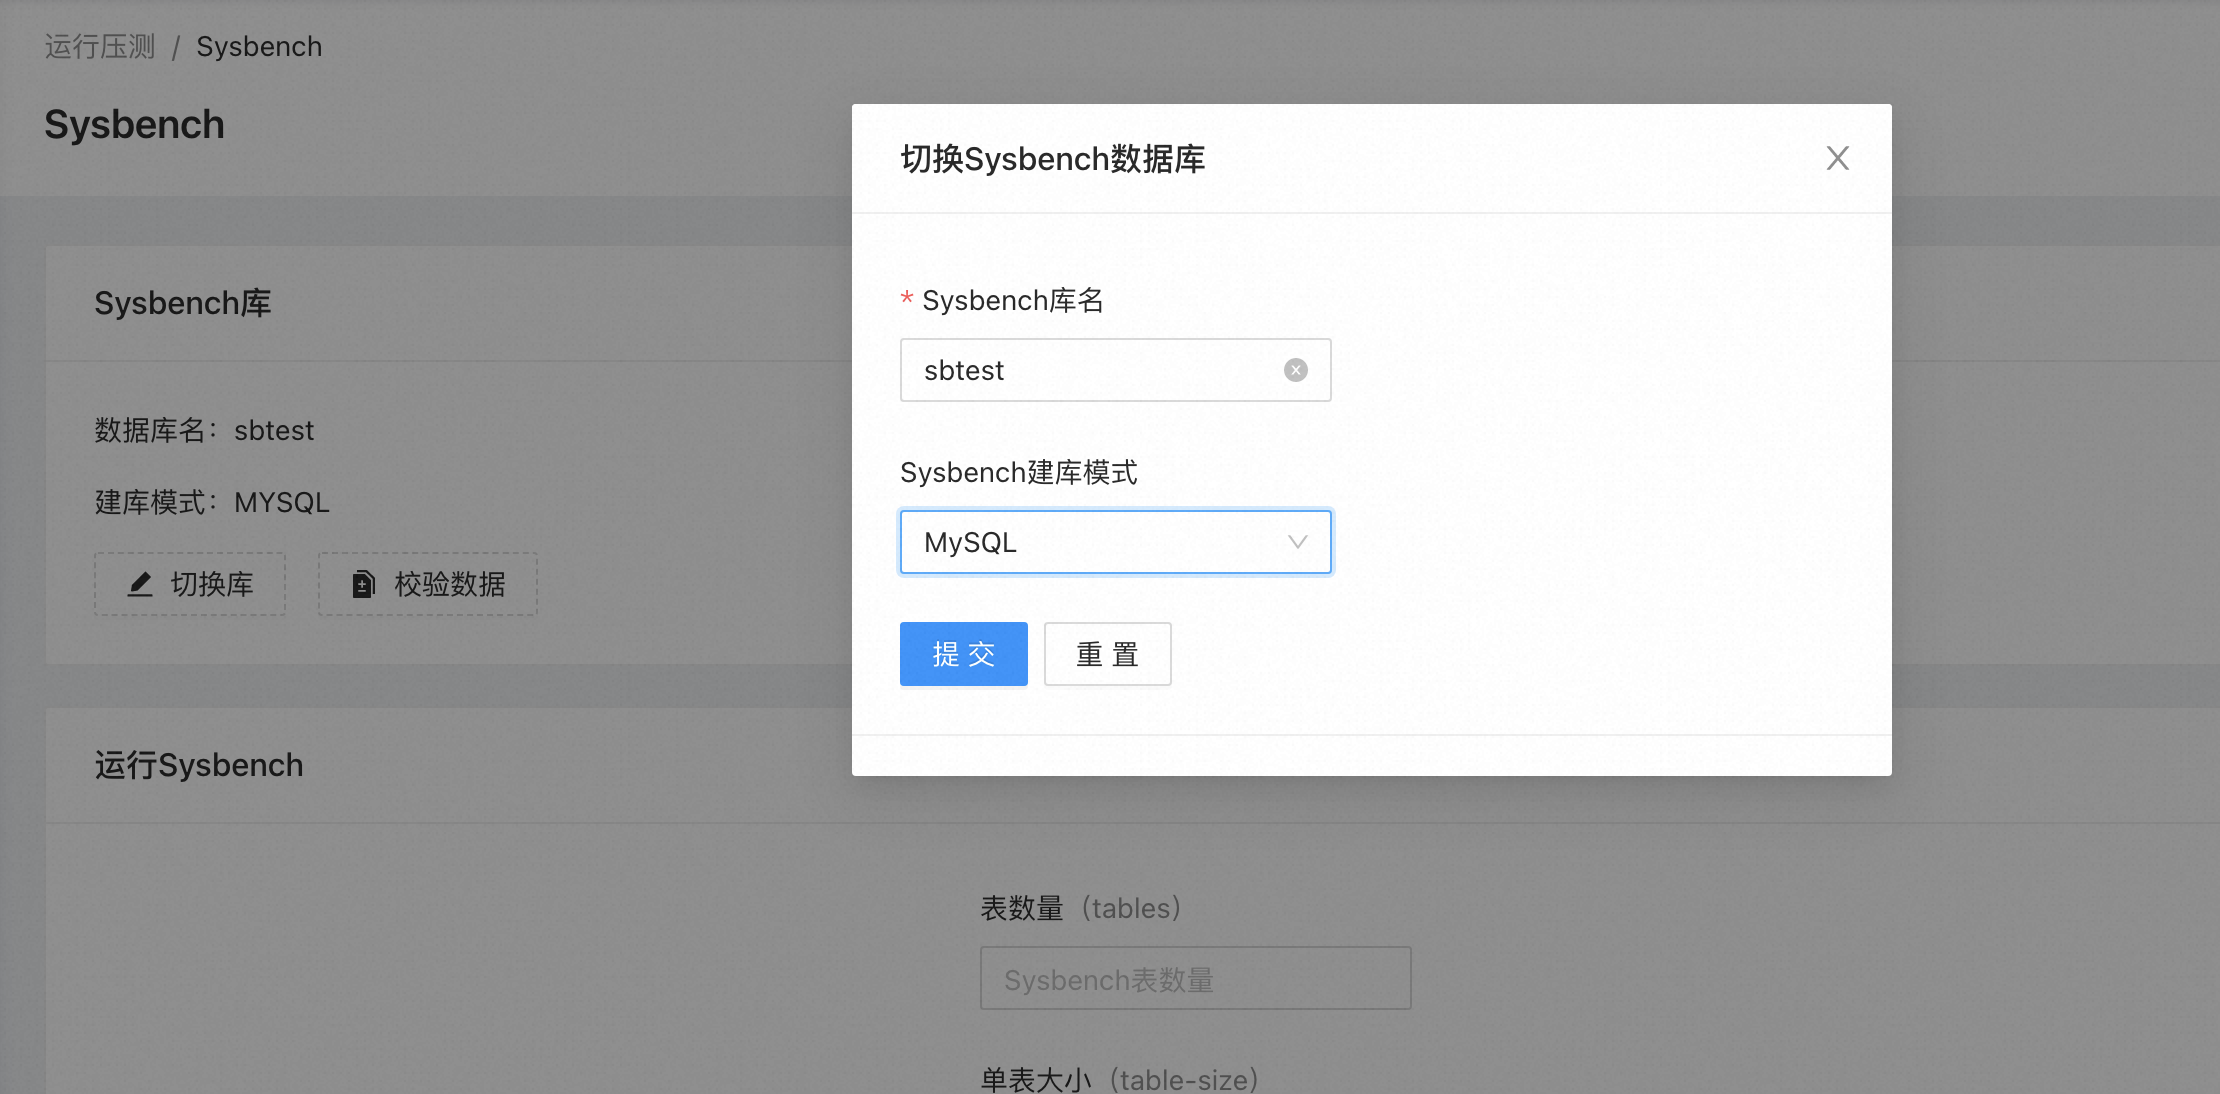
Launch Benchmark-Boot, select 'Run Stress Test' -> 'Sysbench' -> 'Switch Database' on the left, fill in the database name sbtest_mysql, select MySQL mode.
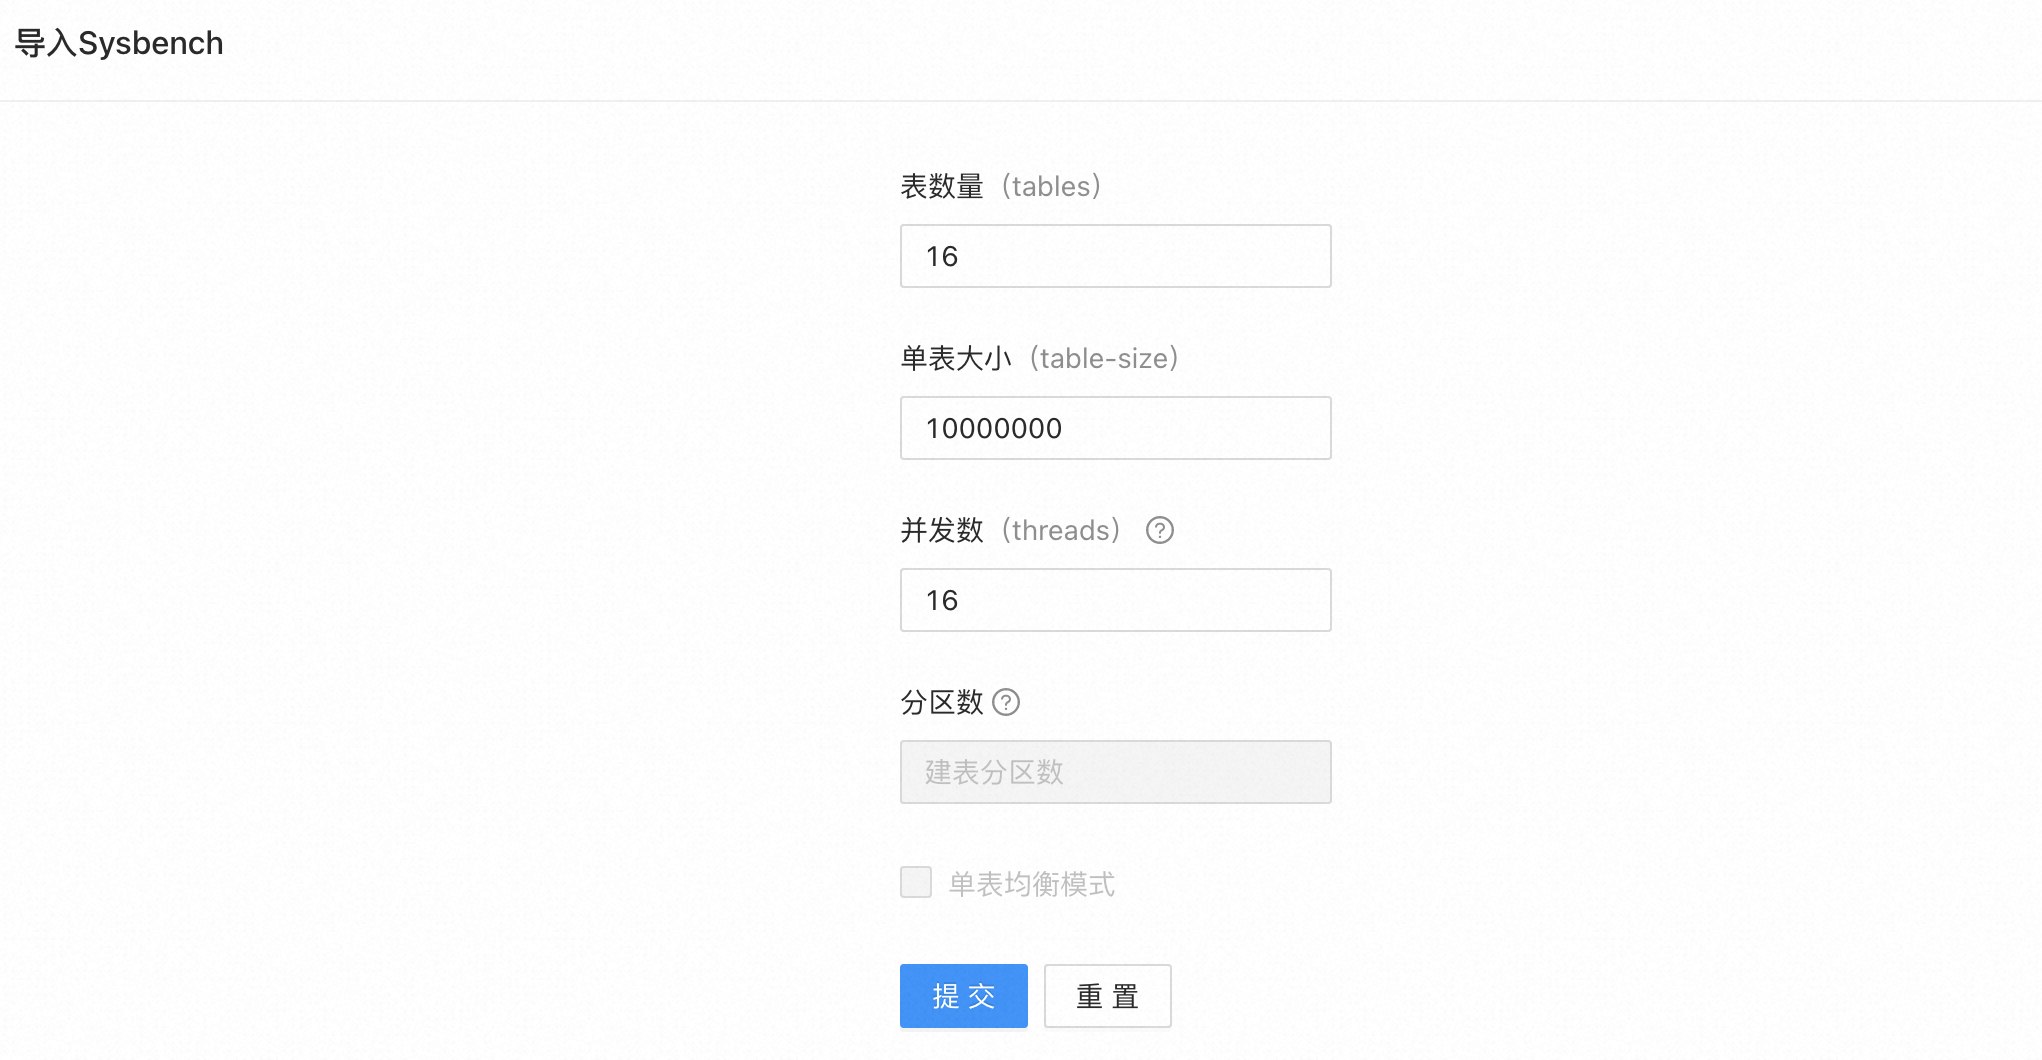
After submitting, scroll down to the bottom of the page, fill in the parameters for data preparation: 16 tables, table size 10000000, 16 concurrent threads, do not check the 'Uniform Distribution for Single Table' option, click submit and wait for the data preparation task to complete.
Step 5: Execute the Stress Test
| Stress Test Scenario | Name |
|---|---|
| Point-Select | oltp_point_select |
| Read-Only | oltp_read_only |
| Read-Write | oltp_read_write |
| Update-Index | oltp_update_index |
| Update-No-Index | oltp_update_non_index |
| Write-Only | oltp_write_only |
The table contains the names of Sysbench scenarios included in this stress test. The following illustrates the stress testing method using the point-select scenario oltp_point_select as an example.
Launch Benchmark-Boot and verify if the database selected for stress testing is correct. If not, click to switch.
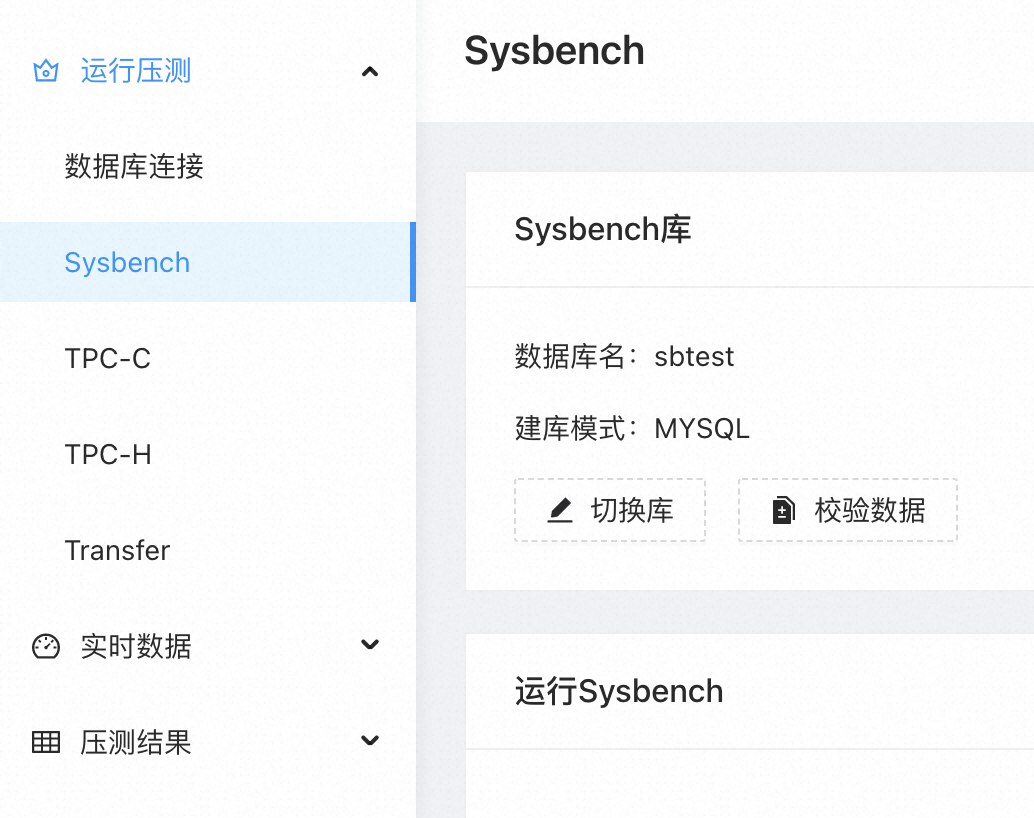
Select Run Stress Test->Sysbench on the left side, then in the Run Sysbench form
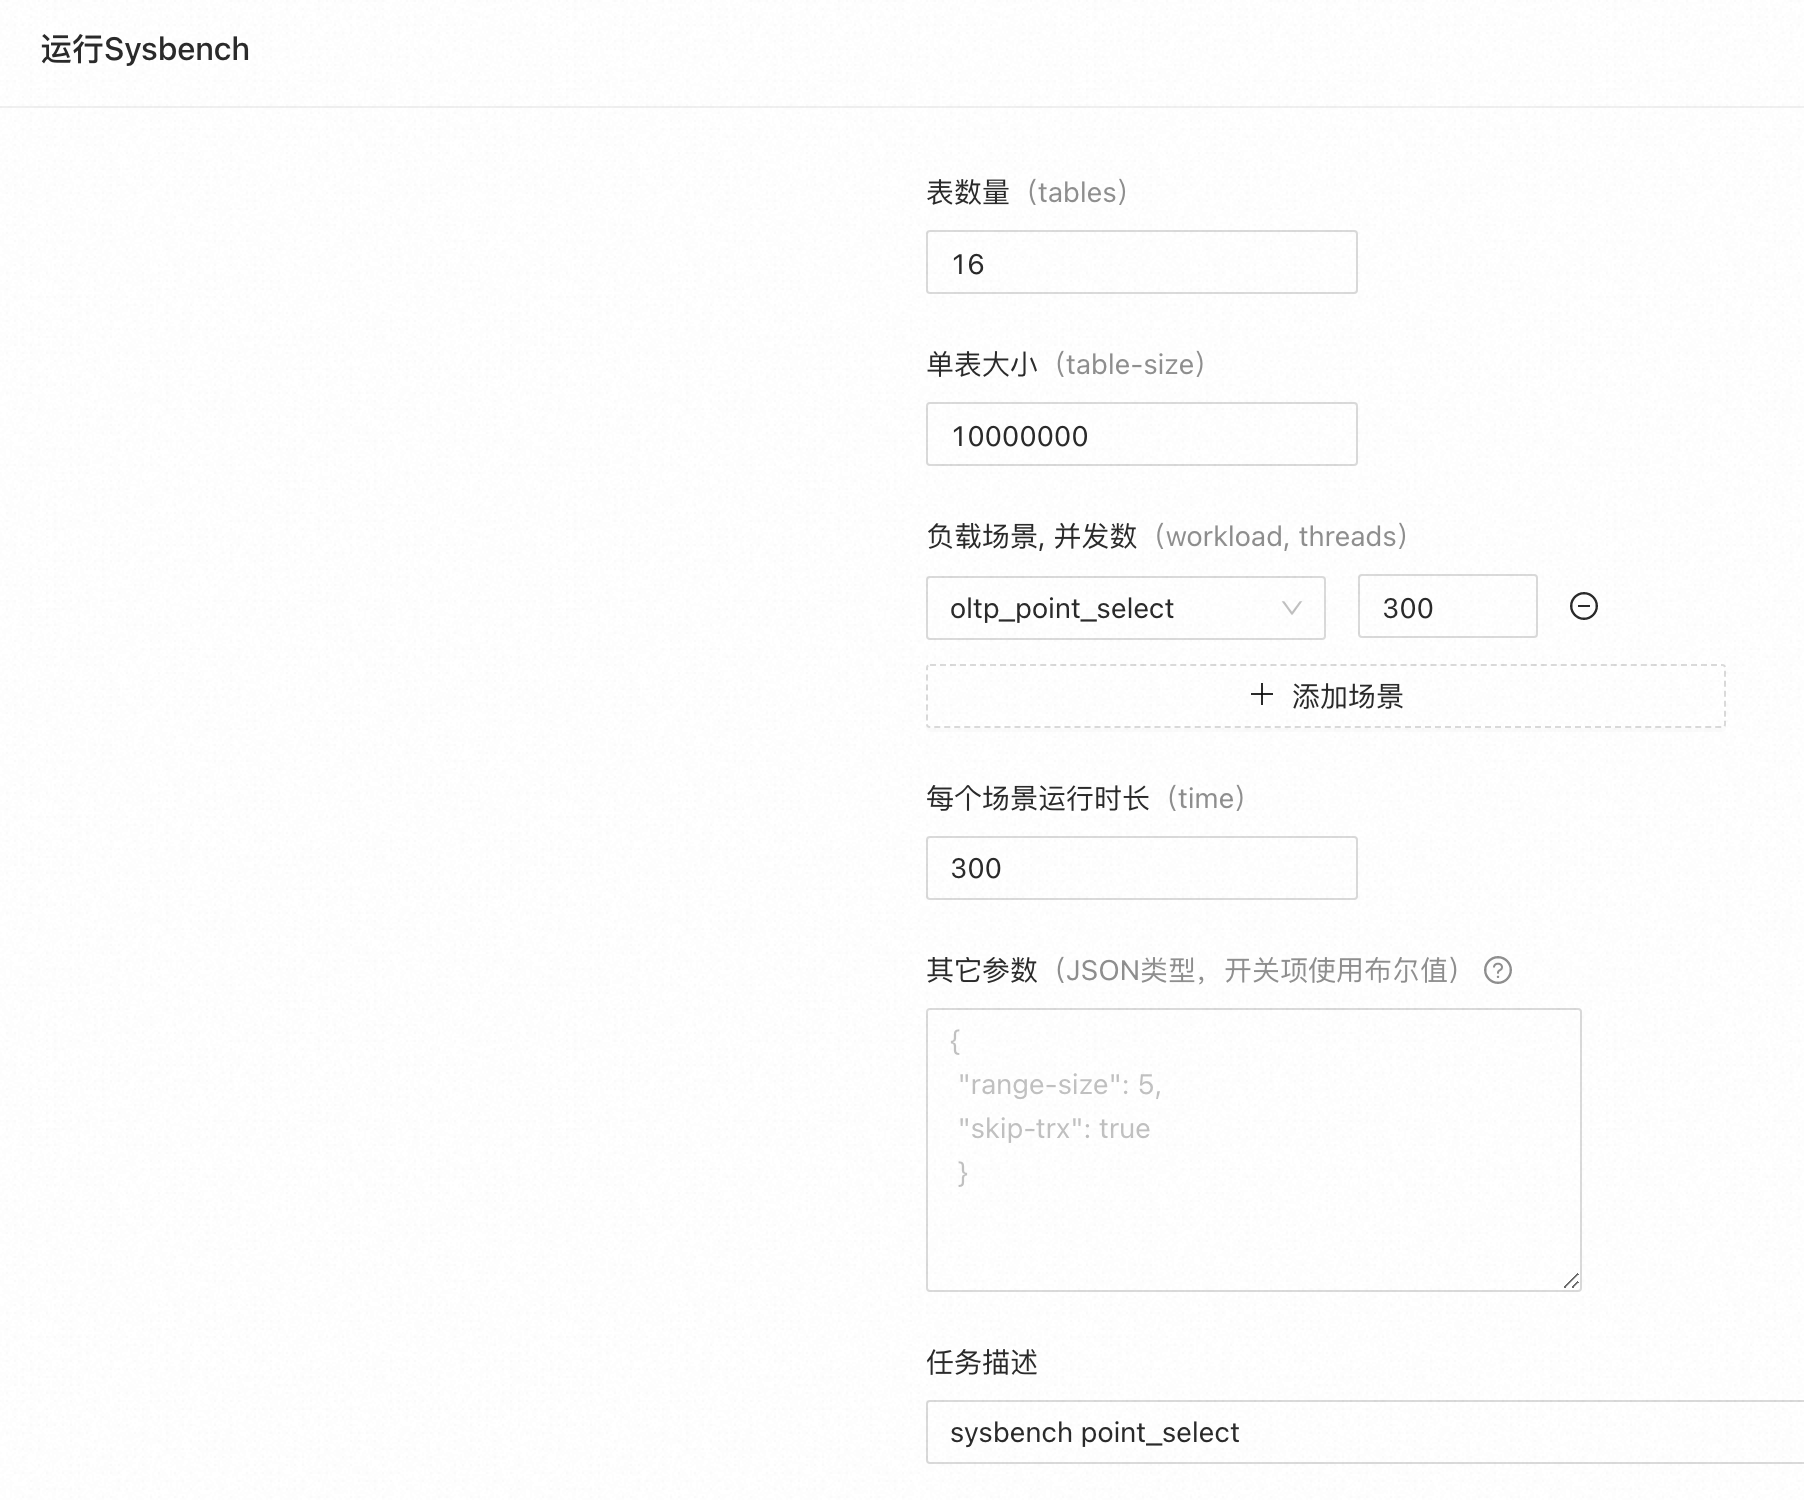
Note that other parameters should be in JSON format. You can copy the following settings, and after setting, click Run Stress Test.
{
"disable-ps-mode":false,
"range-size":5
}
View the stress test results by clicking View Real-Time Results, which takes you to the Real-Time Data page for live results.
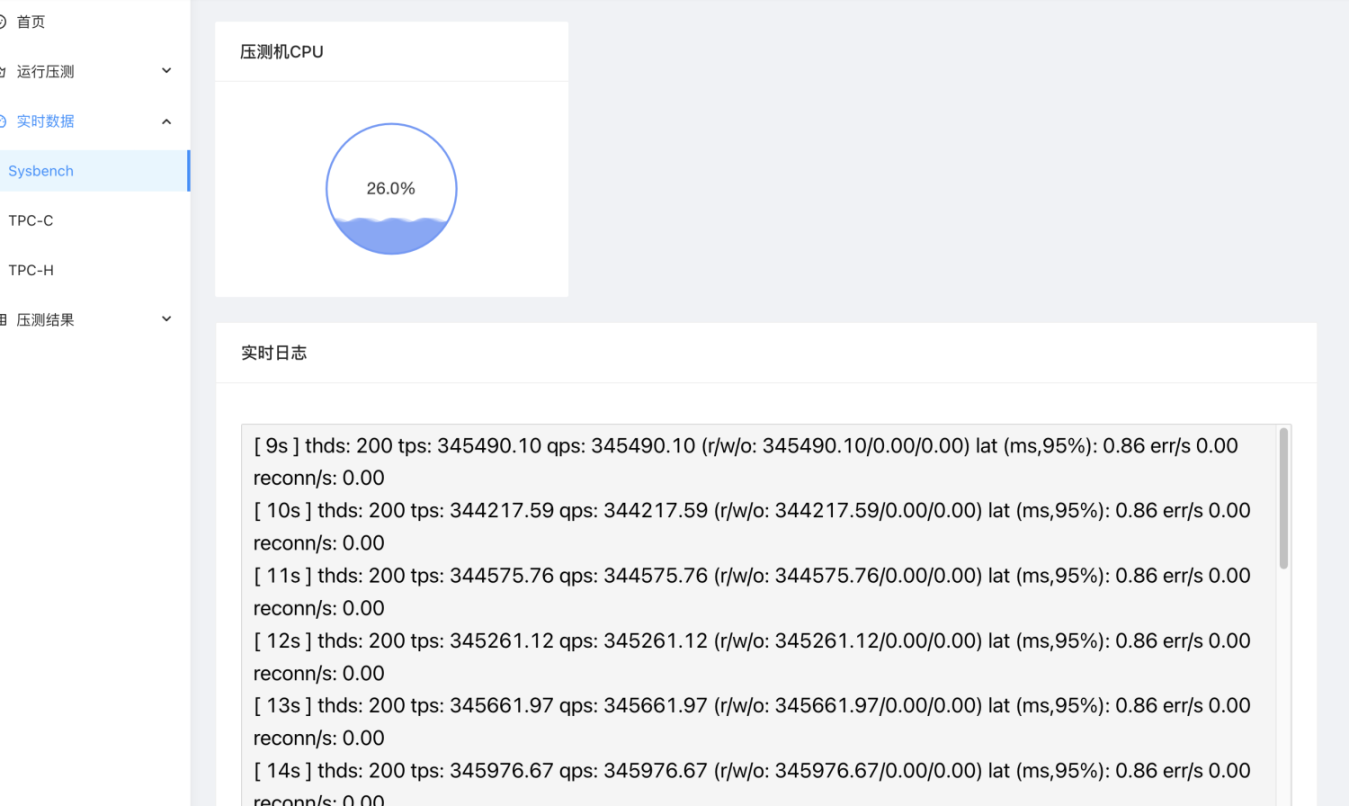
Once the stress test is complete, record the results.
Return to the stress test page where you can choose to fill in the last test parameters. After making slight changes to the scenario or concurrency, you can continue to test other scenarios.
Test Results
All results below use QPS (Queries Per Second) as the performance metric.
Partition Table Performance
| Scenario | 50 | 100 | 150 | 200 | 250 | 300 |
|---|---|---|---|---|---|---|
| oltp_point_select | 317151.01 | 464316.53 | 485389.86 | 487124.91 | 489078.48 | 487684.83 |
| oltp_read_only | 291317.42 | 401566.17 | 420416.04 | 388937.68 | 382861.20 | 413884.86 |
| oltp_read_write | 156294.12 | 199195.62 | 214608.23 | 228713.64 | 254317.93 | 265322.61 |
| oltp_write_only | 38574.92 | 52876.25 | 59393.07 | 62235.96 | 65523.25 | 66866.19 |
| oltp_update_index | 38005.13 | 51803.68 | 58119.58 | 62263.46 | 63918.22 | 64203.57 |
| oltp_update_non_index | 39712.23 | 54418.94 | 64213.46 | 67319.67 | 69110.39 | 70028.34 |