Alert Configuration
The polardbx-operator, based on Prometheus + AlertManager, provides flexible alerting capabilities. This document describes how to configure alerts for clusters created by the polardbx-operator.
Prerequisites
- Install polardbx-operator and polardbx-monitor components, ensuring that the polardbx-monitor version is not lower than 1.4.0.
- Create a PolarDB-X cluster and enable monitoring by referring to the document: Enabling Monitoring for Existing Clusters.
- As sending alert messages requires access to the corresponding channel (email, DingTalk), your K8s cluster needs a machine that can access the channel's Endpoint, such as an SMTP server or DingTalk webhook.
Starting AlertManager and Accessing
PolarDB-X Operator version 1.4.0 has already integrated AlertManager and comes with out-of-the-box alerting capabilities, which can be activated in just a few simple steps.
- Prepare a machine that has access to the alert channel Endpoint and execute the following command to label the node for deploying AlertManager.
kubectl label node {node name} alertmanager=true
Replace {node name} in the command above with the NAME from the kubectl get node result.
Execute the following command to start AlertManager and deploy it on the machine with the alertmanager label.
kubectl patch alertmanager main -n polardbx-monitor --type='merge' -p '{"spec": {"replicas" : 1, "nodeSelector": {"alertmanager": "true"}}}'Execute the following command and wait for the AlertManager pod to be in Running status:
kubectl get pods -n polardbx-monitor alertmanager-main-0Execute the following command to forward the AlertManager port to your local machine and access it via a browser.
kubectl port-forward svc/alertmanager-main --address=0.0.0.0 9093 -n polardbx-monitorEnter http://{ip}:9093/ in the browser to access AlertManager.
Configuring AlertManager for Alert Push Channels
AlertManager supports the configuration of various alert push channels, see:CONFIGURATION。This document will take email and DingTalk as examples to explain how to configure AlertManager to push alerts to email and DingTalk.
Configuring Alerts to be Pushed to Email
1.Create an alertmanger-secret.yaml file and copy the following content into it:
apiVersion: v1
kind: Secret
metadata:
  name: alertmanager-main
  namespace: polardbx-monitor
  labels:
    app.kubernetes.io/instance: polardbx-monitor
    app.kubernetes.io/managed-by: Helm
stringData:
  alertmanager.yaml: |-
    global:
      smtp_smarthost: smtp.gmail.com:587         ## Email configuration for sending alerts
      smtp_from: <smtp mail from>
      smtp_auth_username: <username>
      smtp_auth_identity: <username>
      smtp_auth_password: <password>
    receivers:
    - name: email_receiver
      email_configs:
      - to: <mail to address>    ## Email list to push alerts to
        send_resolved: true
    route:
      group_by:
      - job
      group_interval: 5m
      group_wait: 30s
      receiver: email_receiver
      repeat_interval: 12h
      routes:
      - receiver: email_receiver
        group_wait: 10s
    templates:
    - '/etc/alertmanager/config/*.tmpl'
type: Opaque
- Modify the related configuration items in global and receivers.email_configs.to in the file above, filling in the email information for sending alert emails.
- Execute the following commands to apply the configuration:
kubectl delete -f alertmanger-secret.yaml
kubectl apply -f alertmanger-secret.yaml
Configuring Alerts to be Pushed to DingTalk
AlertManager does not currently directly support DingTalk. To send messages to DingTalk, you need to deploy a DingTalk alert plugin. Through a webhook, AlertManager's messages are converted into DingTalk's alert format and sent out.
- Create a webhook robot in a DingTalk group and record the webhook URL and secret.
- Create dingtalk-webhook.yaml, and copy the following content into dingtalk-webhook.yaml:
apiVersion: v1
data:
  config.yaml: |
    templates:
      - /config/template.tmpl

    targets:
      webhook1:
        # Just modify the URL and secret here
        url: https://oapi.dingtalk.com/robot/send?access_token=e2***
        secret: SECc*****
kind: ConfigMap
metadata:
  labels:
    app: alertmanager-webhook-dingtalk
  name: alertmanager-webhook-dingtalk-config
  namespace: polardbx-monitor
---
apiVersion: apps/v1
kind: Deployment
metadata:
  labels:
    run: dingtalk
  name: webhook-dingtalk
  namespace: polardbx-monitor
spec:
  replicas: 1
  selector:
    matchLabels:
      alertmanager: true
  template:
    metadata:
      labels:
        run: dingtalk
    spec:
      containers:
      - args:
        - --web.listen-address=:8060
        - --config.file=/config/config.yaml
        image: timonwong/prometheus-webhook-dingtalk:v1.4.0
        name: alertmanager-webhook-dingtalk
        ports:
        - containerPort: 8060
          name: http
        resources:
          limits:
            cpu: 100m
            memory: 100Mi
        volumeMounts:
        - mountPath: /config
          name: config
      volumes:
      - configMap:
          name: alertmanager-webhook-dingtalk-config
        name: config
---
apiVersion: v1
kind: Service
metadata:
  labels:
    run: dingtalk
  name: webhook-dingtalk
  namespace: polardbx-monitor
spec:
  ports:
  - port: 8060
    protocol: TCP
    targetPort: 8060
  selector:
    run: dingtalk
  sessionAffinity: None
Note: The URL and secret fields on line 24 should be set to your DingTalk robot's configuration.
- Execute the following command to deploy the DingTalk alert plugin:
kubectl apply -f dingtalk-webhook.yaml
3.Execute the following command to create alertmanger-secret.yaml:
vim alertmanger-secret.yaml
Copy the content below into alertmanger-secret.yaml:
apiVersion: v1
kind: Secret
metadata:
  name: alertmanager-main
  namespace: polardbx-monitor
  labels:
    app.kubernetes.io/instance: polardbx-monitor
    app.kubernetes.io/managed-by: Helm
stringData:
  alertmanager.yaml: |-
    global:
      resolve_timeout: 5m
    receivers:
    - name: dingtalk-webhook
      webhook_configs:
      - send_resolved: true
        url: "http://webhook-dingtalk.polardbx-monitor:8060/dingtalk/webhook1/send"
    route:
      group_by:
      - job
      group_interval: 5m
      group_wait: 30s
      receiver: dingtalk-webhook
      repeat_interval: 12h
      routes:
      - receiver: dingtalk-webhook
        group_wait: 10s
    templates:
    - '/etc/alertmanager/config/*.tmpl'
type: Opaque
- Execute the following commands to apply the alert configuration:
kubectl delete -f alertmanger-secret.yaml
kubectl apply -f alertmanger-secret.yaml
Viewing Existing Alert Rules
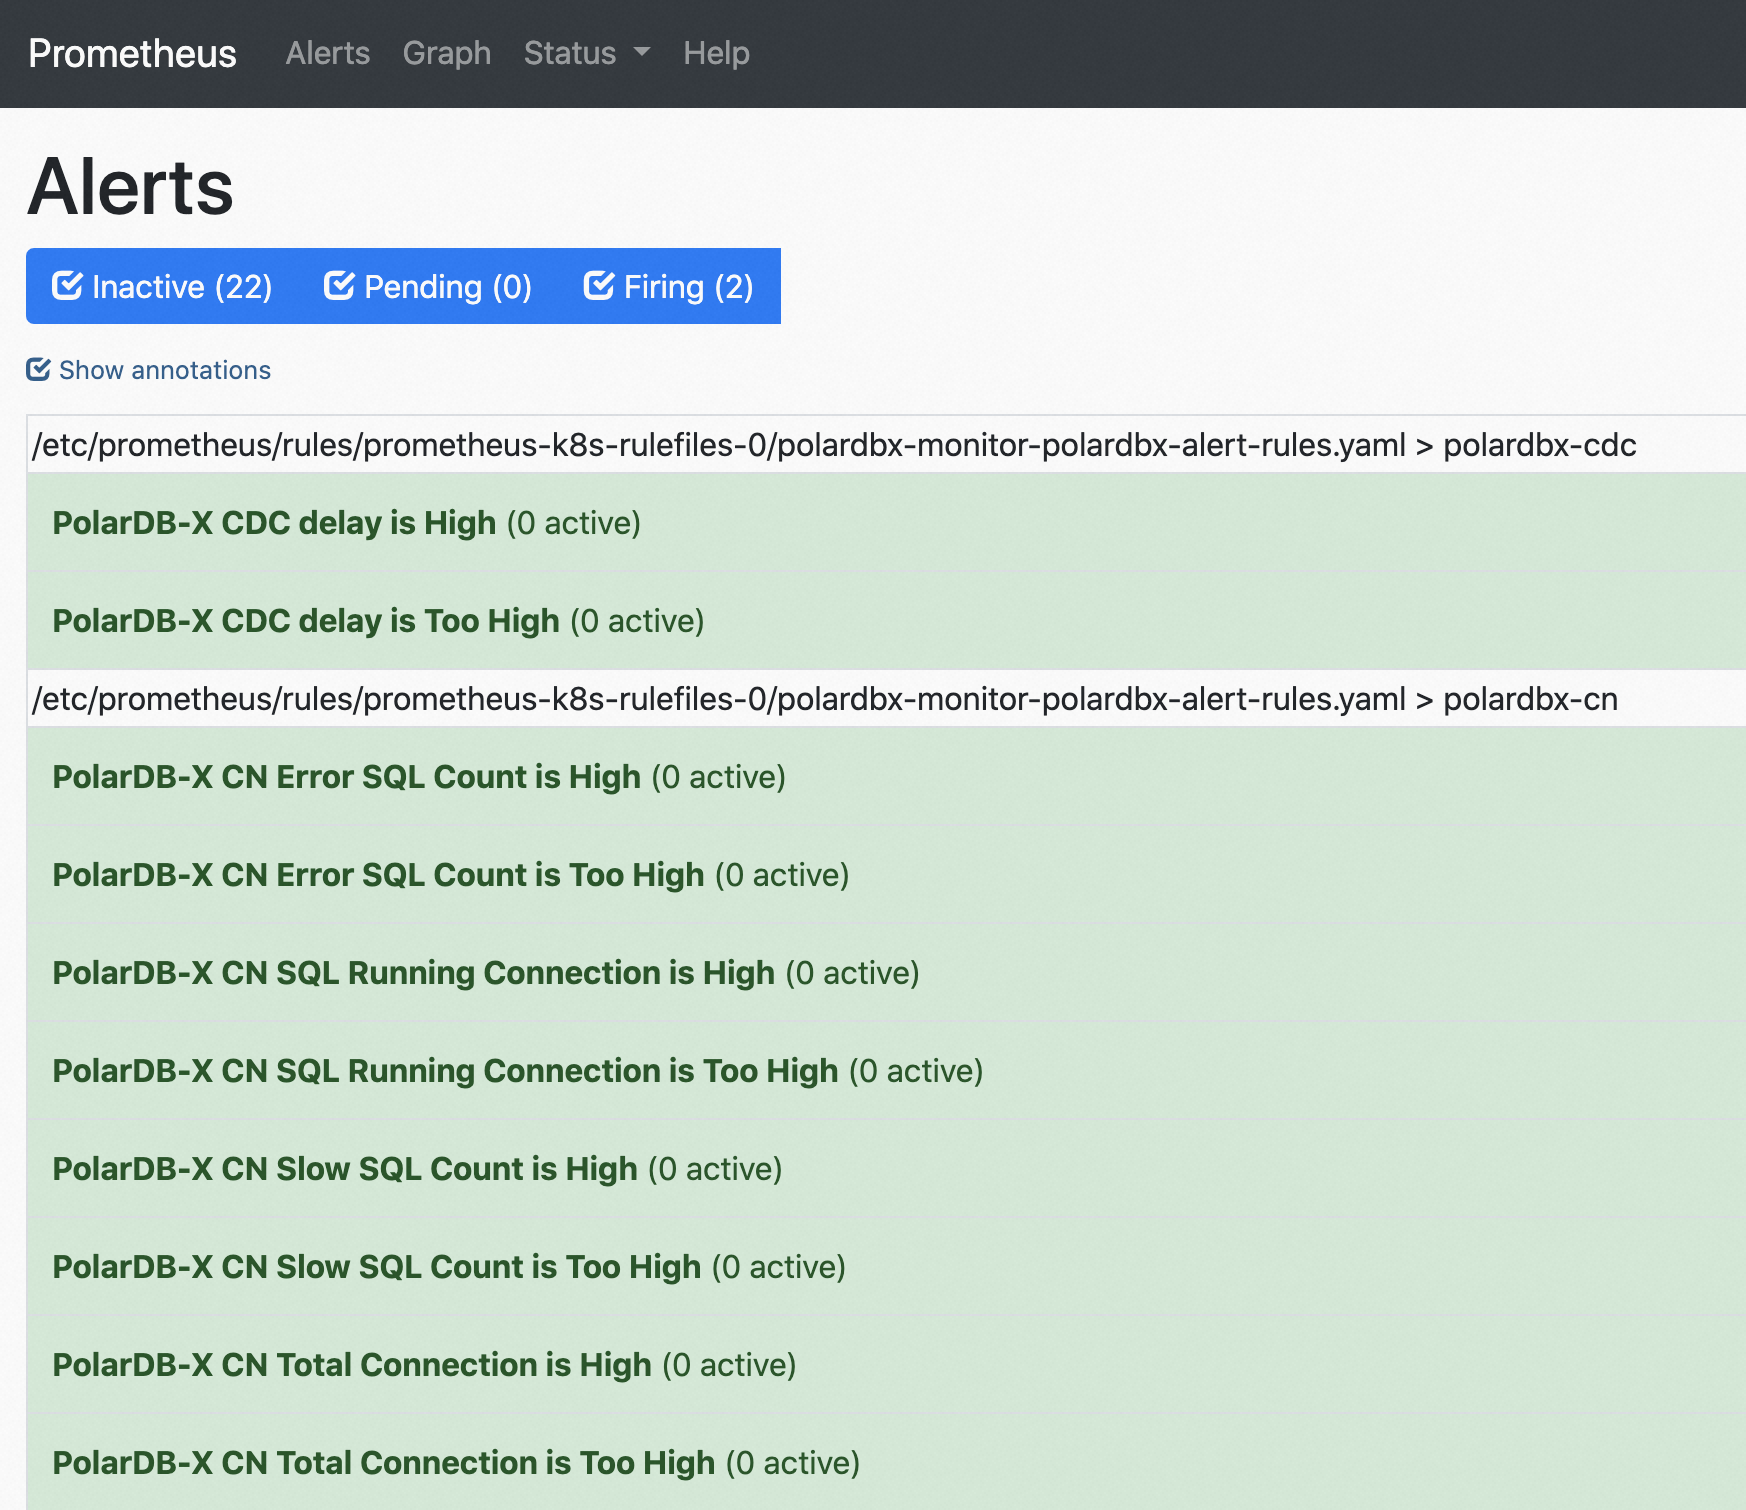
Method 1:Refer to the document:View Monitoring and access the Prometheus console. By viewing the Alerts Tab, you can see the alert rules that have been configured in the system, as shown in the following image:
Method 2:
The alert rules for PolarDB-X are configured through PrometheusRule objects. Execute the following command to check the PolarDB-X PrometheusRule:
kubectl get prometheusrule -n polardbx-monitor polardbx-alert-rules -o yaml
You can also modify the alert configuration or add new alert rules in the PrometheusRule with the following command:
kubectl edit prometheusrule -n polardbx-monitor polardbx-alert-rules