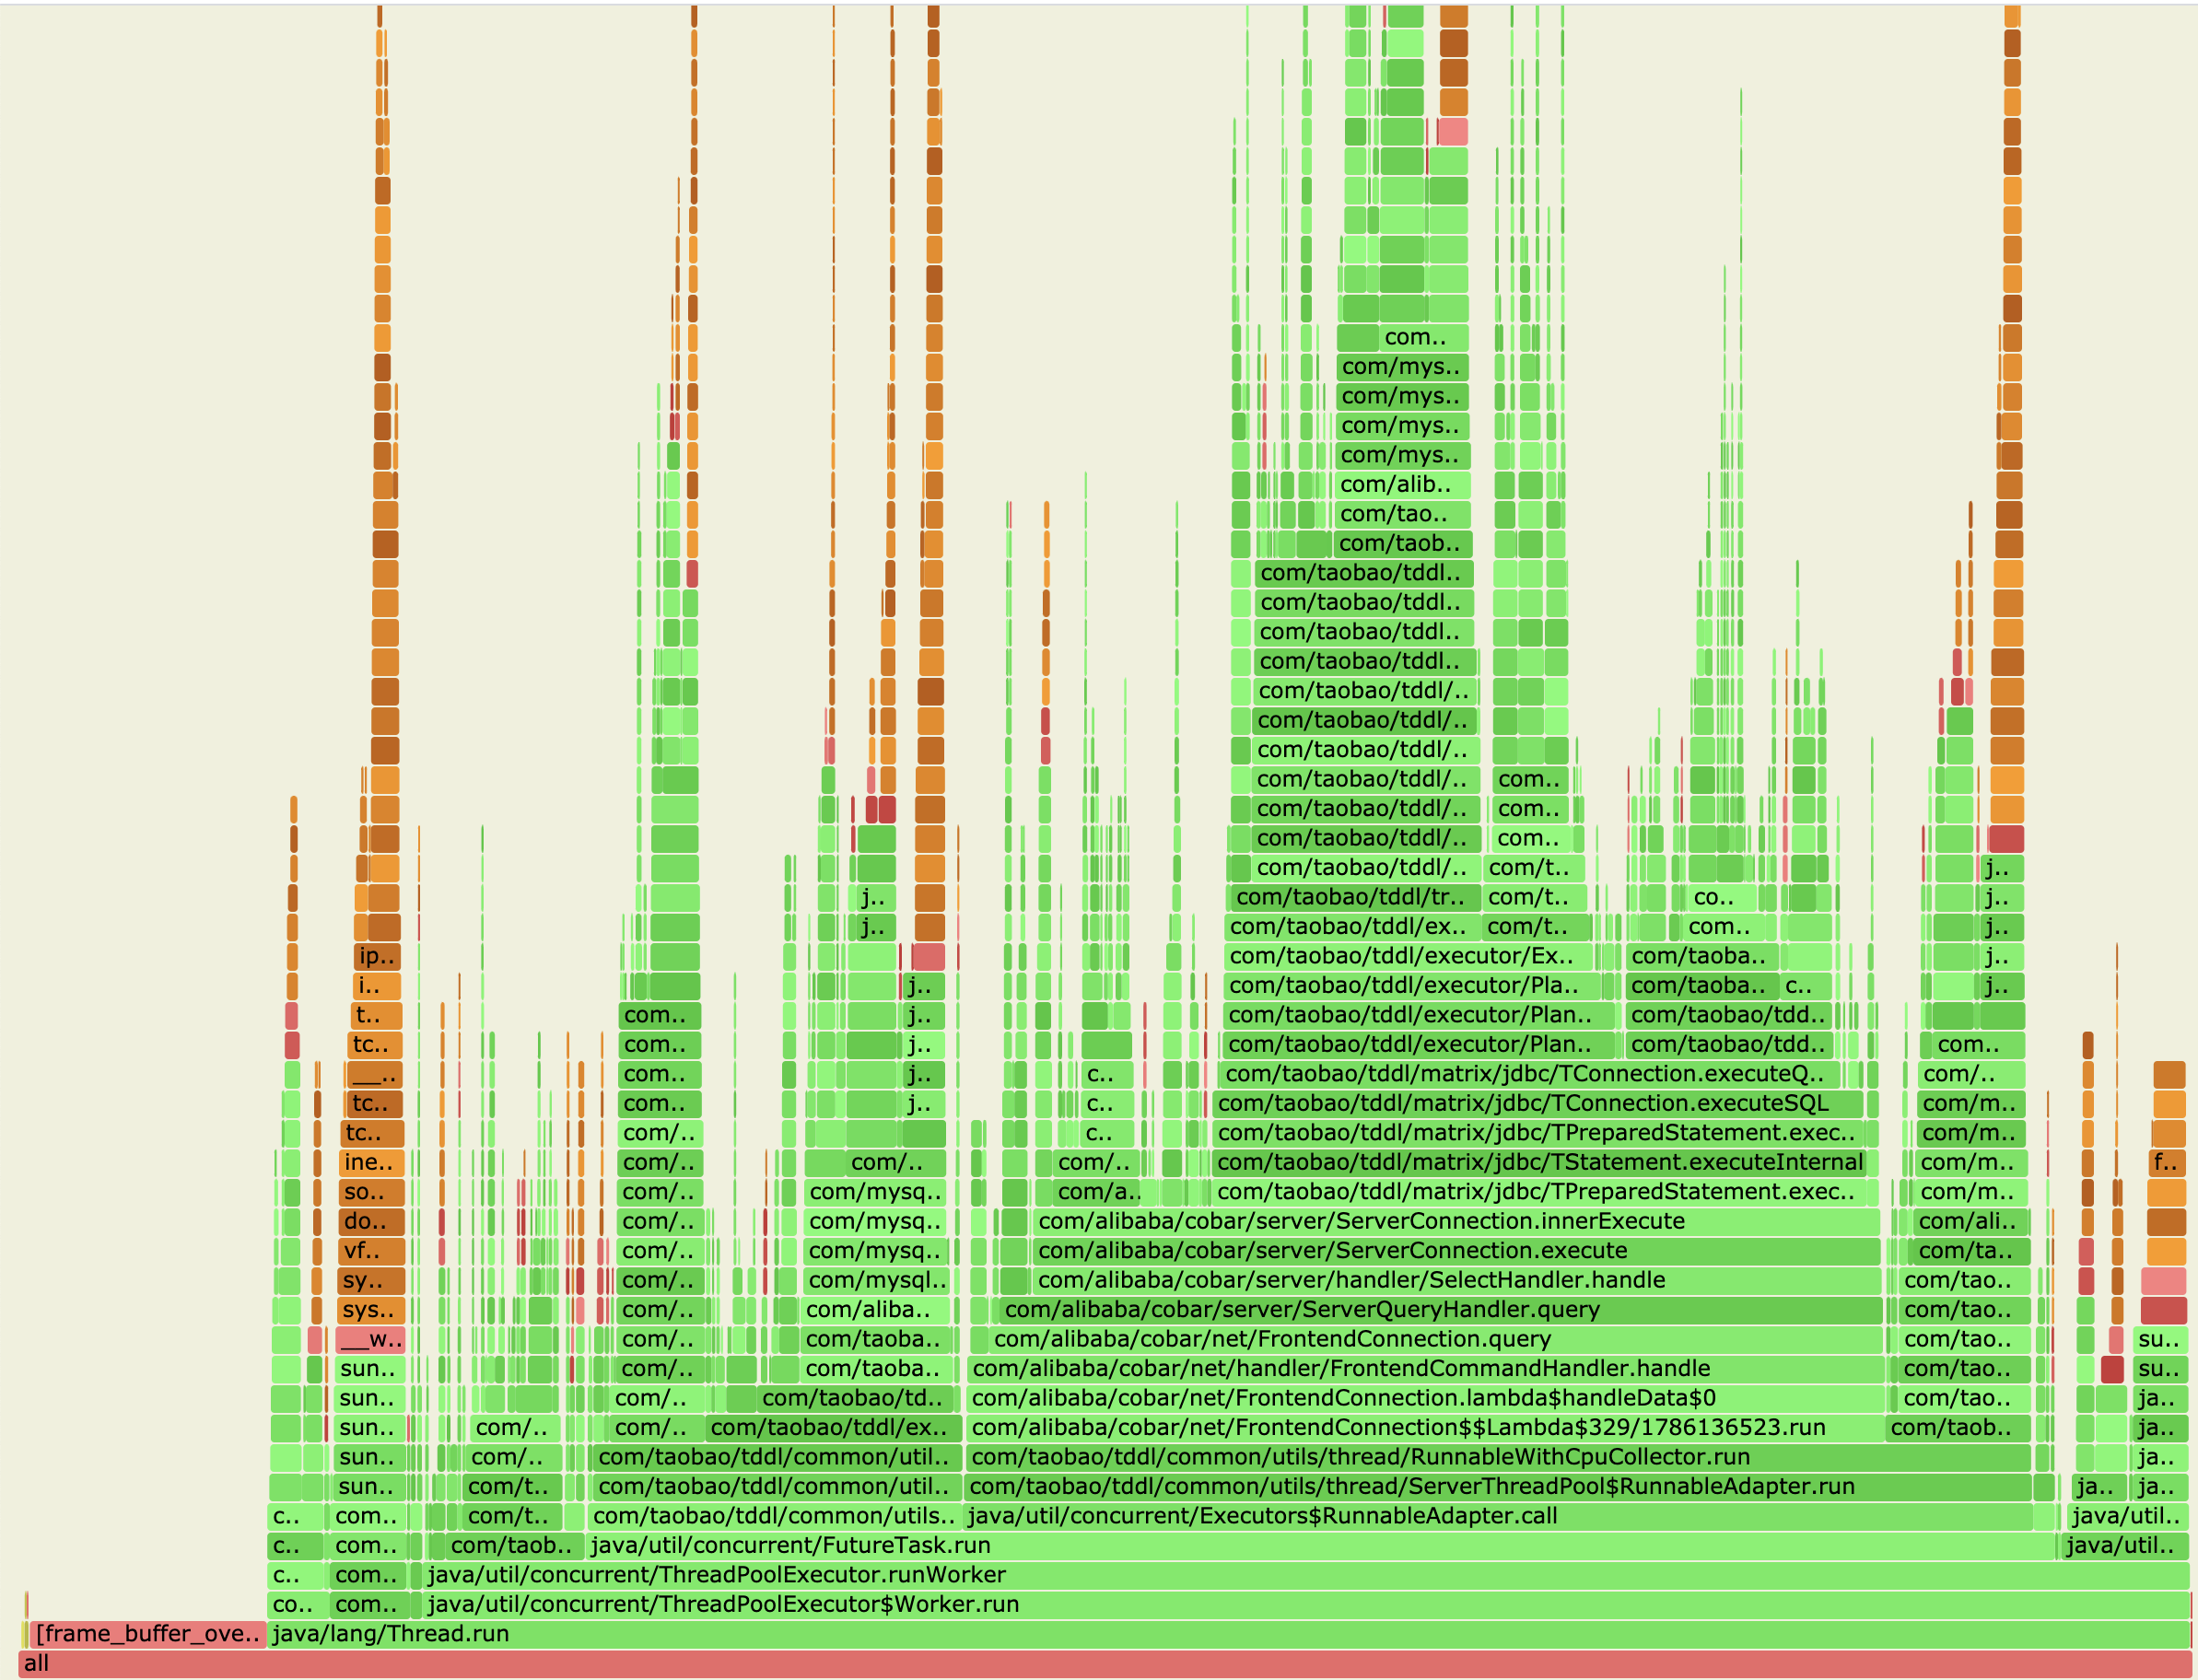
Some older versions of images do not have the corresponding tools integrated, and it is necessary to manually upload the tool package for execution (see attachment). Taking the compute node process in CN as an example, it is as follows:
# Upload profiler tar package to the /tmp directory in the Pod
$ kubectl cp ~/Downloads/async-profiler.tar.gz pxc-yexi-test-cn-c6498459c-hgwn7:/tmp/ -c server

# Access the Pod through bash
$ kubectl exec -it pxc-yexi-test-cn-c6498459c-hgwn7 -c server -- bash

# Unpack the tar package to the /home/admin/tools directory.
$ cd /home/admin/tools && tar xzvf /tmp/async-profiler.tar.gz

# Check process of compute node (TddlLauncher)
$ jps
193 TddlLauncher
467 DrdsWorker
499432 Jps

# Configure the kernel parameter of container, there are two cases:
#   1. If the container is privileged, configure it in container
#   2. If the container is not privileged, cconfigure it in the host machine
$ echo 1 >/proc/sys/kernel/perf_event_paranoid

# Check the kernel parameter is set
$ cat /proc/sys/kernel/perf_event_paranoid
1

# Start profiling
$ ./profiler.sh -d 80  -f /tmp/profiler-drds.svg 193

# Open a new local shell session and download svg flame graph from Pod
$ kubectl cp pxc-yexi-test-cn-c6498459c-hgwn7:/tmp/profiler-drds.svg /tmp/profiler-drds.svg -c server

# Open the flame graph
$ open /tmp/profiler-drds.svg
