Accessing the Grafana Dashboard
By default, execute the following command to forward the Grafana port to your local machine:
kubectl port-forward svc/grafana -n polardbx-monitor 3000
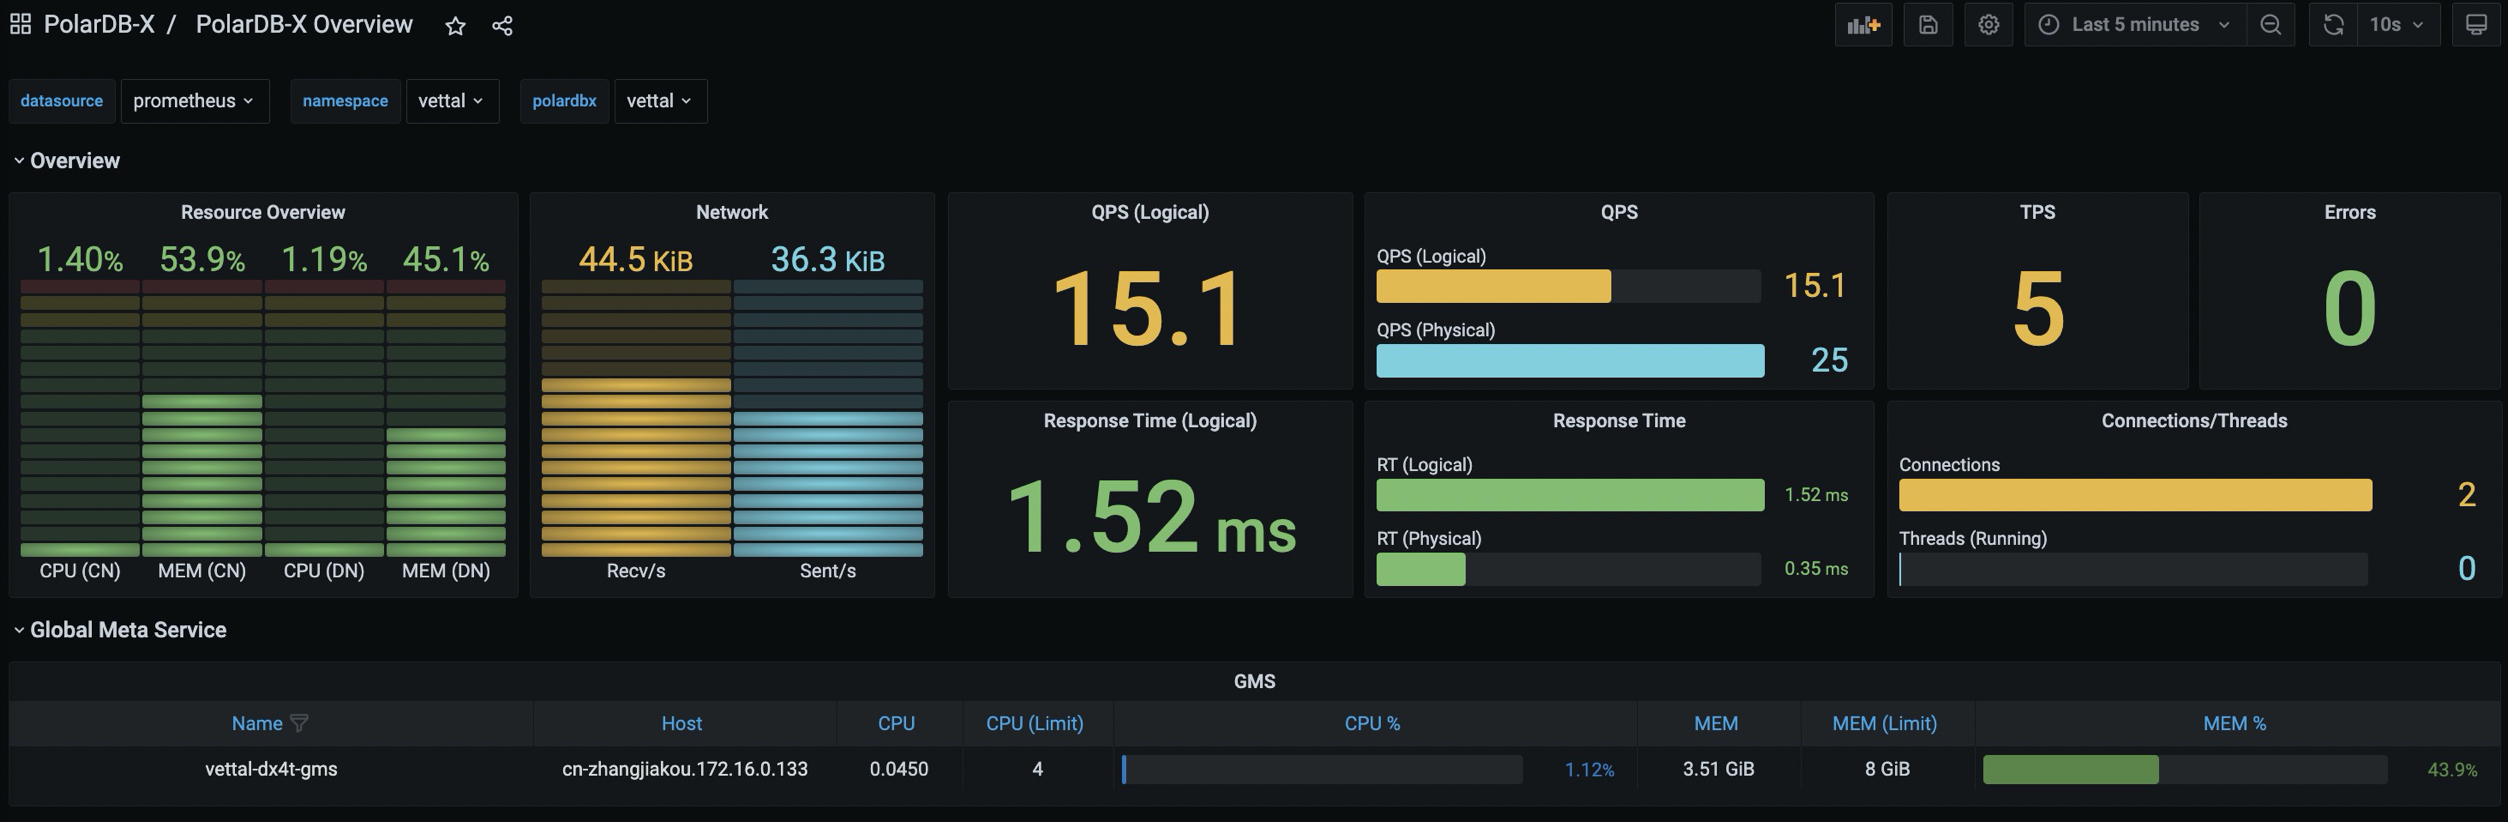
Enter the following URL in your browser: http://localhost:3000, and you will have access to the PolarDB-X Dashboard. The default username and password are both admin. Monitoring information for PolarDB-X Enterprise Edition can be viewed in the PolarDB-X Overview, and the monitoring information for PolarDB-X Standard Edition can be found in the XStore Overview.
Note: Since Grafana's configuration is stored in a ConfigMap, any passwords you change or new Dashboards you add in Grafana will not be persisted. If the Grafana Pod is rebuilt, these configurations will be lost, so please remember to save them in advance.
 If your K8s cluster supports LoadBalancer, you can configure a LoadBalancer for the Grafana Service for access, refer to:
If there are multiple PolarDB-X Clusters in your K8s cluster, you can switch between Namespaces and PolarDB-X Clusters using the dropdown box at the top of the Grafana page.
Accessing Prometheus
By default, execute the following command to forward the Prometheus port to your local machine:
kubectl port-forward svc/prometheus-k8s -n polardbx-monitor 9090
Enter the following URL in your browser: http://localhost:9090, and you will have access to the Prometheus page.
If your K8s cluster supports LoadBalancer, you can configure a LoadBalancer for the Prometheus Service for access, see:Configure Prometheus and Grafana